
Welcome back. In an earlier blog post, U.S. Slave Descendant Genetics, I opened with comments about reparations for slavery, then added, “The effects of redlining neighborhoods for denial of services and discriminatory housing practices, banned years ago, are still felt today.”
Redlining is a subject worthy of its own blog post, especially since it continues to generate new research. I’ll describe redlining then highlight three studies published in recent months.
“Redlining” in Brief
The label “redlining,” credited to Northwestern University sociologist John McKnight in the 1960s, refers to denying or severely limiting service to customers in particular geographic areas.
The practice arose in the 1930s, when the Federal Home Loan Bank Board asked the Home Owners' Loan Corporation (HOLC) to survey 239 cities and create "residential security maps" for mortgage lending. “Desirable” neighborhoods were color-coded green, those “still desirable” blue, areas “definitely declining” yellow; and the most risky or “hazardous“ red.
 |
| HOLC residential security map of Charlotte, N.C. 1937: Green, 1st Grade, Desirable; Blue, 2nd Grade, Still Desirable; Yellow, 3rd Grade, Declining; Red, 4th Grade, Hazardous (from: www.blackpast.org/african-american-history/redlining-1937). |
Redlined neighborhoods were those that local lenders discounted as credit risks, largely because of the predominant racial and ethnic demographics--African Americans as well as Catholics, Jews and immigrants from Asia and southern Europe.
The Federal Housing Administration institutionalized the system of discriminatory lending until 1968, when the Fair Housing Act banned racial discrimination in housing.
While the primary examples of redlining involve denial of credit and insurance, denial of healthcare and the development of food deserts in minority neighborhoods have also been cited.
Redlining Associated with Lower Life Expectancy
University of Maryland researchers set out to gauge Baltimore’s historical redlining with today’s health.
They digitally overlaid the Baltimore area map of the 1930s HOLC’s security categories with a map of the 54 planning board-defined community statistical areas. CSAs include racial composition, median household income, various health outcomes as well as neighborhood features such as rate of liquor stores.
 |
| Baltimore CSA neighborhoods (numbers) in light purple overlaid on 1930s HOLC residential security map: Green, Desirable; Blue, Still Desirable; Yellow, Declining; Red, Hazardous (from journals.plos.org/plosone/article?id=10.1371/journal.pone.0261028). |
The researchers view the maps as proxies for government policy that systematically disenfranchised and harmed the largely Black residents of those neighborhoods.
Redlining Associated with Elevated Air Pollution
Researchers affiliated with the University of California, Berkeley and the University of Washington related redlining with air pollution in 202 U.S. cities.
For each city, they integrated HOLC security maps; year-2010 estimates of two air pollutants, nitrogen dioxide (NO2) and fine particulate matter (PM2.5); and demographic information from the 2010 U.S. census. Pollution levels were consistently linked with HOLC categories, especially for NO2, which was 50% higher in red than in green neighborhoods. Racial and ethnic disparities were observed within each HOLC category, with higher exposure levels to both pollutants for people of color than for White people.
Redlining Associated with Oil and Gas Wells
A team of researchers from the University of California, Berkeley, University of California, San Francisco and Columbia University assessed exposure to urban oil and gas wells among HOLC-graded neighborhoods in 33 cities from 13 states.
The racially discriminatory redlined neighborhoods had twice the density of operating oil and gas wells than comparable neighborhoods that scored highest.
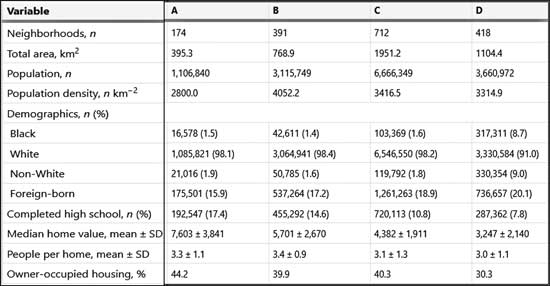 |
| Population characteristics from 1940 U.S. Census of 17 cities with at least 10 wells within 100 meters of a HOLC graded neighborhood (A-Desirable to D-Hazardous); demographic variables are not mutually exclusive; home value reported in US dollars (from journals.plos.org/plosone/article?id=10.1371/journal.pone.0261028). |
Wrap Up
I’ll close with a recent study that addressed environmental inequality, which encompasses proximity to polluting industries, limited access to clean water and green spaces, and the ability to mediate the effects of climate change. Research has shown Black communities suffer environmental problems more than White communities of similar income levels.
Analyzing responses to a nationally representative survey of 1,000 U.S. households, a Washington State University researcher found what he called, color-blind environmental racism: 59% believed poverty is a root cause of environmental inequality, and only 37% believed Black people are more likely than White people to experience pollution.
Even among those who believe environmental inequality, some feel that it is “fair,” that it is up to the people living near polluting industries to work harder so they can move.
It reminded me why critical race theory is important. Thanks for stopping by.
P.S.
Selected articles on redlining:
www.washingtonpost.com/news/wonk/wp/2018/03/28/redlining-was-banned-50-years-ago-its-still-hurting-minorities-today
www.cbsnews.com/news/redlining-what-is-history-mike-bloomberg-comments/
www.investopedia.com/terms/r/redlining.asp
en.wikipedia.org/wiki/Redlining
projects.fivethirtyeight.com/redlining/
Study of redlined Baltimore communities in PLOS One journal: journals.plos.org/plosone/article?id=10.1371/journal.pone.0261028
Article on study on EurekAlert! website: www.eurekalert.org/news-releases/939906
Study of urban redlining and higher air pollution in Environmental Science & Technology Letters: pubs.acs.org/doi/abs/10.1021/acs.estlett.1c01012
Article on study on EurekAlert! website: www.eurekalert.org/news-releases/945366
Study of redlining and oil and gas well siting in Journal of Exposure Science & Environmental Epidemiology: www.nature.com/articles/s41370-022-00434-9
Article on study on EurekAlert! website: www.eurekalert.org/news-releases/949670
Study of Americans’ belief about environmental inequality in Social Problems journal: academic.oup.com/socpro/advance-article/doi/10.1093/socpro/spac005/6540708?login=true
Article on study on EurekAlert! website: www.eurekalert.org/news-releases/949576
No comments:
Post a Comment