Showing posts with label Twitter - Tweets. Show all posts

08 July 2022

U.S. Anti-Asian Tweets

Welcome back. Forgive my gloom, but it’s getting hard to keep up with the hate in America.

Citing a report on 2021 hate crime data by the Center for the Study of Hate and Extremism, an NBC News article identified Black Americans as the most targeted group in most cities, Jews in New York, gay men in Chicago, and the most hate crimes of any U.S. city this century in Los Angeles.

The focus of that NBC News article was anti-Asian hate crimes, which jumped 339% in 2021 compared to 2020, when New York, San Francisco, Los Angeles and other cities had record numbers.

Members of K-pop band BTS visit White House to film an anti-Asian hate video with President Biden and address the topic with the press, 31 May 2022 (The White House/Adam Schultz photo from www.teenvogue.com/story/bts-white-house-visit-2022).
Analyzing Anti-Asian Hate in the U.S.
The anti-Asian hate incidents arising from the messaging that blamed COVID-19 on China led a team of researchers affiliated with Utah and Arizona State universities to examine anti-Asian hate in the U.S.

Approaching the study as a first step toward understanding whether racist trends on social media give rise to harm in the real world, their analyses relied on tweets.

The researchers purchased 4,234,694 geolocated tweets from Twitter, then searched the dataset for tweets that were located in the contiguous U.S.; written in English; sent in the early stage of the COVID-19 outbreak, November 2019 to May 2020; and had keywords reflecting COVID-19.

They classified the resulting 3,274,614 tweets into hateful or non-hateful based on the presence of additional keywords related to anti-Asian hate (e.g., kungflu).

Temporal Analysis of Hateful Tweets
From November 2019 to May 2020 the number of daily hateful tweets was very low until January 2020, when they began to surge, culminating in the first of two spikes.

The first spike occurred when COVID-19 was initially reported in the U.S. The second spike occurred in mid-March, when former President Trump began tweeting about the “Wuhan flu” and “Chinese virus.”

Anti-Asian COVID-related tweets, Nov. 2019-May 2020; red line is total number of daily tweets in study’s dataset; blue line is percentage of tweets that express hateful sentiment (graphic by Alexander Hohl from ajph.aphapublications.org/doi/full/10.2105/AJPH.2021.306653).
In time, the number of anti-Asian tweets fell, yet it remained higher than before the pandemic.

Spatial Analysis of Hateful Tweets
The researchers plotted the anti-Asian hateful tweet locations on a U.S. map. Although the tweets were scattered across the U.S., there were 15 geographic clusters where the number of tweets were statistically higher than expected based on the underlying population. (The strongest cluster was in Ross County, Ohio, where the proportion of hateful tweets was about 300 times higher than the rest of the country.)

Along with mapping the hateful tweets and clusters, the researchers also calculated what they labeled the relative risk for every U.S. county. This statistic was the ratio of the number of hateful tweets sent inside a county to the number of hateful tweets sent outside the county.

 Spatiotemporal distribution of continental U.S. hateful tweets against Asians and Asian Americans, highlighting 15 clusters and counties’ “relative risk,” defined as ratio of hateful tweets sent inside a county versus outside (from attheu.utah.edu/facultystaff/anti-asian-hate-tweets-during-covid-19/).
Wrap Up
The researchers plan to continue their analyses, seeking to identify demographic and socioeconomic factors that explain cluster locations and to determine if the mapping can predict where racists attacks are most likely to occur.

The maps might thus contribute to informing decision-makers in public health and safety when allocating resources for place-based preparedness and response to pandemic-induced racism. That would be a good thing.

Thanks for stopping by.

P.S.
NBC News article on anti-Asian hate crimes: www.nbcnews.com/news/asian-america/anti-asian-hate-crimes-increased-339-percent-nationwide-last-year-repo-rcna14282
Center for the Study of Hate and Extremism, California State University, San Bernardino: www.csusb.edu/hate-and-extremism-center
Study of anti-Asian tweets in American Journal of Public Health: ajph.aphapublications.org/doi/full/10.2105/AJPH.2021.306653
Articles on study on EurekAlert! website and University of Utah Communications:
www.eurekalert.org/news-releases/954418
attheu.utah.edu/facultystaff/anti-asian-hate-tweets-during-covid-19/


13 August 2021

Tapping Twitter’s Potential

Welcome back. In case you were wondering, I don’t have a Twitter account. Yes, I sometimes check friends’ tweets about technical news, and yes, I certainly considered joining the Twitterverse. I even shared my pros and cons in a long-ago blog post, Tweet?.

More important, I want to tell you about a powerful, new tool for curating and analyzing tweets, specifically, about 10% of all the tweets made every day around the globe. I think you’ll find it of interest.

Twitter’s Potential
Paul Lewis, with The Guardian, described Twitter as the digital footprint of things that are happening around the world. And there’s no question that Twitter, founded in 2006, has tremendous promise if one can get by the lies and rumors.

As early as 2009, Jake Coyle, with the Associate Press, wrote: Twitter has in many ways been a boon to the media…Most outlets now have a presence on Twitter with a feed directing readers to their respective sites… But truthfulness remains the biggest problem…False rumors spread daily on Twitter.

An exemplar topic addressed in different research investigations in Twitter’s early years was its use for detecting disease outbreaks. Through the years, Twitter’s value for reporting outbreaks and disasters has been demonstrated repeatedly, though rumors have often interfered (see my post Tweets Misreport Disasters).

All of which brings me to Storywrangler, the tool developed by researchers with the University of Vermont, Charles River Analytics and MassMutual Data Science.

Storywrangler website header (storywrangling.org/).
Storywrangler
Storywrangler provides a natural language processing framework that extracts, ranks and organizes tweets, generating frequencies for words (1-, 2- and 3-word phrases), hashtags, handles, numerals, symbols and emoji.

Capturing time-stamped messages and storylines in more than 150 languages, from Twitter’s inception to the present, Storywrangler makes the datasets available through an interactive time-series viewer and as downloadable time-series and daily distributions.

While Storywrangler could, in principle, be modified to operate on other social media platforms, Twitter offers some advantages. One noteworthy example is Twitter’s social amplification mechanisms--retweets and quote tweets, which enable the explicit encoding of popularity.

Visual Comparison of Phrase Popularity

In their published paper, the researchers presented a sample of Storywrangler’s online viewer visualizations. On one graph, they illustrated how different Twitter features capture three global events from the first half of 2020.

Storywrangler visualizations of three global events from first half of 2020: the death of Iranian general Qasem Soleimani; the beginning of the COVID-19 pandemic (term “coronavirus” as yellow, virus emoji, green); and the Black Lives Matter protests following the murder of George Floyd (from advances.sciencemag.org/content/7/29/eabe6534/tab-article-info).
Storywrangler showed a spike of tweets and retweets of the word "Soleimani" on 3 January, when the U.S. killed the Iranian general Qasem Soleimani with a drone strike.

There was a rise of the word "coronavirus" as well as the virus emoji as COVID-19 spread with the beginning of the pandemic in the spring.

And the hashtag "#BlackLivesMatter" jumped on and after 25 May, the day George Floyd was murdered.

Wrap Up

Storywrangler can be used to follow, trace and explore the serious and the not-so serious--disasters, political matters, vaccines, federal reserve actions, entertainment, fashion, dark matter, the dark web--and monitor discourse by or about the famous and the not-so famous.

But as the Storywrangler website warns, Twitter provides a non-representative subsample of utterances made by a non-representative subsample of Earth’s population; and Storywrangler reflects only a random 10% of those messages.

Though Storywrangler doesn’t resolve the lies and rumors that come with Twitter, the tool provides the opportunity to dig a little deeper. That’s at least a head start. Thanks for stopping by.

P.S.

Twitter:
en.wikipedia.org/wiki/Twitter
twitter.com
Twitter’s potential:
- Jake Coyle: abcnews.go.com/Technology/story?id=7979891&page=1
- Paul Lewis: theconversation.com/how-twitter-has-helped-the-emergence-of-a-new-journalism-19841
Study on development of Storywrangler in Science Advances journal: advances.sciencemag.org/content/7/29/eabe6534/tab-article-info
Article on study on EurekAlert! website: www.eurekalert.org/news-releases/527597
Storywrangler website: storywrangling.org/


06 August 2021

Emoji

Welcome back. Forgive me. I’m certain most of you didn’t need my reminder, but I neglected to alert you that 17 July was World Emoji Day.

For those who may not recognize the word from Japanese, emoji or emojis (either is plural) are pictograms, logograms or ideograms and smileys used in electronic messages and web pages to add emotional cues to typed conversation.

I’ll bet you’ve seen smiley faces. Well, there are 3,521 approved emoji. In recognition of World Emoji Day, the draft candidates for the next emoji release, Emoji 14.0, were revealed along with the results of Adobe’s 2021 Global Emoji Trend Report.

Examples of candidate emoji for 14.0 release include a melting face, a face holding back tears, new handshake combinations, a gender-neutral person wearing a crown, a pregnant man, a troll with a club and coral (from emojipedia.org/emojipedia/14.0/).

Although I can’t recall adding an emoji to anything I’ve ever written, I appreciate their creativity. I’ll do my best to tell you about emoji, summarize the trend report and highlight a recent study of how the world uses emoji. To squeeze it all in, I’ll tuck ample references under the P.S.

Emoji Admin

The working list of emoji is determined by the California-based Unicode Consortium. The consortium is a non-profit corporation devoted to developing, maintaining and promoting software internationalization standards and data, particularly the Unicode Standard, which specifies the representation of text in software products and standards.

Consortium members include computer corporations, software producers, database vendors, government ministries, research institutions, international agencies and others.

Emojipedia, a member of the Unicode Consortium, is the central bank of all approved emoji. Emojipedia’s reference website documents the meaning and common usage of each emoji character.

The draft emoji announced on World Emoji Day may change prior to final approval in September. Companies such as Apple, Google and Microsoft apply stylized versions of the consortium's designs to their operating systems, vendor designs vary from those released by major vendors, and Emojipedia's draft images may be updated. The emoji will likely be seen on all platforms by June 2022.

Global Emoji Trend Report
Adobe’s Global Emoji Trend Report for 2021 is based on a survey of 7,000 emoji users in Australia, France, Germany, Japan, South Korea, the U.K. and U.S. Though details of how the survey was conducted weren’t available, I was impressed by some of the results.

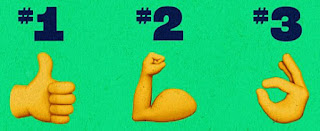
Global emoji users’ top five favorite emoji (from blog.adobe.com/en/publish/2021/07/15/global-emoji-trend-report-2021.html#gs.656huw).

Global emoji users find emoji make it easier to communicate across language barriers (89% of respondents); can help spark positive conversations about cultural and societal issues (70%); and are an important communication tool for creating unity, respect and understanding (76%).

On the personal side, the users find emoji make it easier to express themselves (90%); are more likely to feel empathetic toward someone if they use an emoji (88%); and are more comfortable expressing emotions through emoji than over the phone (55%) or in-person (51%). They feel that using emoji has positively impacted their mental health (65%).

The most effective work motivating emoji (from blog.adobe.com/en/publish/2021/07/15/global-emoji-trend-report-2021.html#gs.656huw).

In the work environment, global emoji users like it when people use emoji (66%). They feel their use helps share ideas quickly (73%); can improve the efficiency of team decision-making (63%); and positively impacts likeability (71%) and credibility (62%).

How the World Uses Emoji
Researchers with the University of Southern California analyzed tens of millions of tweets, in 30 languages and countries, to evaluate how 1,700 emoji are used on Twitter in different linguistic and national contexts.

Total number of unique emoji (about 600 to 1700) in tweets of 30 different language codes in October 2016 (from www.sciencedirect.com/science/article/pii/S2468696421000318).
Employing rigorous statistical and informational theoretical methodologies, the researchers determined that emoji usage and diversity are strongly dependent upon both language and country, the latter having a more pronounced effect.

The popularity of emojis, globally and within a given language, seems to follow a robust trend that is language-independent. They emerge quickly, over a single day, and remain largely consistent thereafter.

Findings regarding specific emoji usage and countries, though interesting, may be out of date given that the study relied on data collected over one month in 2016.

Wrap Up
The most important study takeaway was that emoji represent the human condition; we are more alike than different. Universal emotions dominate.

To close, I’ll draw from the Global Trend Report to make the case that you and I should use emoji. Global emoji users think people who use emoji are friendlier, funnier and…get this...cooler than those who don’t (67%). Thanks for stopping by.

P.S.
Emoji:
en.wikipedia.org/wiki/Emoji
unicode.org/standard/standard.html
en.wikipedia.org/wiki/Unicode_Consortium
Emojipedia:
emojipedia.org/
en.wikipedia.org/wiki/Emojipedia
World Emoji Day: en.wikipedia.org/wiki/World_Emoji_Day
Emoji 14.0:
blog.emojipedia.org/new-emojis-in-2021-2022/
emojipedia.org/emojipedia/14.0/
www.dailymail.co.uk/sciencetech/article-9794749/Heres-emoji-set-coming-smartphone-2022.html
Adobe’s 2021 Global Emoji Trend Report: blog.adobe.com/en/publish/2021/07/15/global-emoji-trend-report-2021.html#gs.656huw
Study of emoji usage on Twitter in Online Social Networks and Media journal: www.sciencedirect.com/science/article/pii/S2468696421000318
Article on study on EurekAlert! website: www.eurekalert.org/pub_releases/2021-07/uosc-hdt071321.php

16 April 2021

Women’s Sports Uncovered

Welcome back. Did you catch any of the March Madness games? The women’s tournament? With all the hoopla focused on the men’s tournament, you’ll probably be surprised that a tally of Twitter and Instagram counts found 8 of the 10 most-followed players on the final eight teams were women.

Coach Tara VanDerveer cuts down the net after Stanford beat Arizona for the 2021 women's national title (AP photo by Morry Gash from chroniclet.com/photo-single/155963/?mode=team).

The fans must have been excited to see those players in action. The women’s tournament was televised, even if there was relatively little on televised sports news and highlights shows. Unfortunately, the lack of coverage is nothing new; women’s sports are usually ignored. At least that’s what Purdue and the University of Southern California researchers have documented every 5 years from 1989 to 2019.

Data Collection and Analysis
For their 2019 effort, the researchers followed the same methodology they applied in assessing the quantity and quality of men's and women's sports news coverage since 1989. They sampled and analyzed three 2-week blocs of televised news in March, July and November on NBC, CBS and ABC Los Angeles affiliates and on the ESPN SportsCenter program. When available, the continuous running ticker at the bottom of the television screen was included. As a first, they also added online daily sports newsletters and official NBC, CBS and ESPN Twitter accounts.

Men’s vs. Women’s Sports Coverage
The enormous gap between men’s and women’s sports coverage in 2019 appeared in every way.

Airtime
Less than 6% of airtime was devoted to women’s sports (i.e., about 94% to men’s sports). Most of women’s sports coverage was in July, when the U.S. women’s soccer team won the World Cup and U.S. women were competing in the Wimbledon tennis tournament. Airtime in March and November was only 1.7% and 0.7%, respectively.

The proportion of airtime devoted to women’s sports on three network affiliates’ sport news and on ESPN’s SportsCenter, 1989–2019 (from journals.sagepub.com/doi/full/10.1177/21674795211003524).

Women’s sports fared better in online newsletters (8.7%) and Twitter (10.2%); however, most was due to espnW, which ended its weekly newsletter following the July 2019 data collection period.

Lead Stories
Like all news shows, sports open with the most important or engaging story of the day. Of the 251 broadcasts analyzed in 2019, five led with a women’s sports story; all five were on the U.S. Women’s soccer team winning the World Cup. Of the 93 online newsletters analyzed, eight led with a story about women’s sports.

Men’s “Big Three”
In their 2009 analysis, the researchers reported that sports coverage was becoming less diverse; 68% of the airtime was devoted to what they labeled men’s Big Three--college and professional basketball, baseball and football. That rose to 75% in 2019, with the remaining 25% shared by other men’s sports, gender-neutral topics and women’s sports.

Televised news and highlights, online newsletters and social media sports coverage, by gender (excludes espnW), 2019 (from journals.sagepub.com/doi/full/10.1177/21674795211003524).

Never Too Early or Too Much
Since moving to Wisconsin, I’ve been amused by TV network affiliates’ year-round coverage of the Green Bay Packers whether important or trivial.

The researchers point out that the dominance of men’s Big Three sports on TV news and highlights programs is amplified by in-season as well as off-season reporting. In 2019, men’s professional basketball had nearly as much off-season as in-season coverage, while women’s professional basketball was covered only in-season. Worse, even in-season, women’s sports stories may be superseded by off-season men’s sports stories.

Notably, the community and charitable contributions of men athletes and teams were frequently featured in news and highlights shows, but women athletes’ contributions, including their social justice activism, seldom made it into women’s sports stories.

Wrap Up
Women’s sports coverage hasn’t changed in quantity for 30-years, yet there have been striking changes in the ways they’re reported. In the 1990s, women athletes were routinely trivialized, insulted and humorously sexualized. By the 2000s, sports news viewed women athletes less offensively, instead underlining their roles as wives, girlfriends or mothers. In 2014, women’s sports was being delivered in a boring, inflection-free manner.

I began and end with March Madness. The researchers found that, in 2019, their local network affiliates and ESPN’s SportsCenter devoted no more than 5% of their combined coverage to the women’s tournament, the online newsletter articles and tweets about 11%. Go girls!

Thanks for stopping by.

P.S.
Most-followed players on men’s and women’s elite eight teams: www.axios.com/ncaa-basketball-social-media-followings-a98b2f21-e907-4276-b860-32565654d64a.html
Study of women’s televised sports, 1989-2019, in Communication & Sport journal: journals.sagepub.com/doi/full/10.1177/21674795211003524
Article on study on EurekAlert! website: www.eurekalert.org/pub_releases/2021-03/uosc-nmk032221.php

12 March 2021

The U.S. Capitol Attackers

Welcome back. The January 6 attack on the U.S. Capitol was difficult to watch and more difficult to comprehend. As various investigations dig deeper into all facets of the insurrection, the George Washington University Program on Extremism released a preliminary assessment of the participants.

Trump supporters trying to break through a police barrier during Jan. 6 Capitol Hill siege (Associated Press photo by John Minchillo).
At the time of the report, 257 people had been charged in federal court. (That number now exceeds 300 and is still climbing.) The GW program reviewed hundreds of court case documents, Department of Justice press releases, Freedom of Information Act requests, interviews with government officials and news to track and categorize the 257 alleged siege perpetrators.

Although the data and findings will certainly evolve, I found the report fascinating and thought you would find some highlights of interest.

Preliminary Findings
- The alleged perpetrators included 221 men and 36 women, average age 40 (18 to 70), from 40 states and more than 180 counties; fewer than 10% were from the Washington metro area.

- 13% had military backgrounds, and of those, 36% had links to extremist groups, mainly the Proud Boys, Oath Keepers and Three Percenters. (The GW investigators thought the range of right-wing groups was particularly striking. Such groups often splinter and form rivalries, though in some cases there is enough common cause to mobilize together as they did in 2017 for the Charlottesville rally.)

- Those charged could be placed into 1 of 3 categories: militant networks characterized by hierarchical organization and chains of command; organized clusters, especially groups of family and friends; and inspired believers. Unlike individuals in the other categories, those in the militant networks coordinated logistics, methods and plans of action in the weeks before January 6. They are alleged to have planned to breach the Capitol and, in many cases, conduct violence inside the walls of the building.

Trump supporters climbing west wall of the U.S. Capitol during Jan.6 siege (Associated Press photo by Jose Luis Magana).
- The alleged perpetrators face an average of 5 counts and as many as 17, with charges ranging from trespassing and illegal entry to conspiracy against the U.S. government and assault of law enforcement officers.

- Social media played heavily in federal court evidence. Charging documents for 83% contained evidence from social media--47% from their personal accounts; 30% from the accounts of others in their networks; and 7% from both. Regarding evidence on personal social media accounts, 15% of extremists publicly indicated their intent prior to storming the Capitol, 68% documented their actions in real time and 25% commented on events in the days and weeks that followed.

QAnon supporter of Trump confronting U.S. Capitol Police outside of Senate chamber during Jan. 6 siege (Associated Press photo by Manuel Balce Ceneta).
Wrap Up
In time, recommendations will be forthcoming from congressional committees and others. The recommendations of the GW program’s preliminary report focused on the need to improve access to data on domestic terrorism investigations, conduct a systematic review of intelligence gathering and policy response to domestic terrorism alerts, and use existing structures to improve information-sharing between the federal agencies tasked with combating domestic violent extremism.

We’ve got a long way to go. Thanks for stopping by.

P.S.
George Washington University Program on Extremism: extremism.gwu.edu/
GW Program’s preliminary assessment of Capitol Hill siege participants: extremism.gwu.edu/sites/g/files/zaxdzs2191/f/This-Is-Our-House.pdf
Article on report on EurekAlert! website: www.eurekalert.org/pub_releases/2021-03/gwu-nro030121.php
Related articles on Capitol Hill siege:
www.usatoday.com/storytelling/capitol-riot-mob-arrests/
www.npr.org/2021/03/02/972539274/fbi-director-wray-testifies-before-congress-for-1st-time-since-capitol-attack

25 March 2019

Vaccination Tweet Meddling

Welcome back. Every now and then, there’s an interesting study I’d like to review for this blog, but because mainstream media has covered the study extensively, I set it aside. On rare occasion, I revisit that decision and risk having you set the blog aside…like today.

Most Americans believe vaccinations are safe and effective, though you might get the impression from social media that the topic is up for debate. Collaborating researchers from George Washington, Maryland and Johns Hopkins universities studied the Twitter discourse about vaccinations with two aims: (1) assess the impact of bots and trolls and (2) analyze the content of Russian troll activity.


Twitter bot tweets Twitter
user
(multiple websites).
To be sure we’re together, I’ll note that an internet bot (from “robot”) is a software application that performs automated tasks. A Twitter bot may autonomously tweet, re-tweet or direct message other Twitter accounts, promoting content.  
A disguised internet troll uses
Twitter
(from www.genbeta.com).

Internet trolls are people who misrepresent their identities with the intention of promoting discord with offensive, divisive or controversial comments.

Testing Bot and Troll Vaccine-Related Tweets
The researchers reviewed nearly 1,800,000 tweets sent between July 2014 and September 2017 to quantify the effect of known and suspected Twitter bots and trolls.

To test if Twitter bots and trolls tweet about vaccines more frequently than do average Twitter users and if those tweets are more likely to be pro-vaccine, anti-vaccine or neutral, the researchers compared tweets sampled from known bot and troll accounts against tweets selected randomly.

Going further with the comparisons, they applied a machine-learning classifier (Botometer) to a random subset of vaccine-related tweets, scoring the likelihood that the tweet’s author was a bot from 0% to 100%.

In the course of their analysis, the researchers encountered vaccine-related tweets from accounts that NBC News had identified as Russian troll accounts. They examined 253 of those tweets to capture the major themes.

Impact of Bots and Trolls
The researchers collected 899 vaccine-related tweets to represent the activity of known bots and trolls and 9,895 vaccine-related tweets to represent the activity of assorted Twitter users. Scoring the latter found 5% were likely authored by humans, 3% by bots and 76% were of uncertain provenance; for various reasons, 16% could not be scored (e.g., accounts deleted).

The known bots and trolls were more likely to tweet about vaccination than did average Twitter users, but overall, the messages were no more polarized. In contrast, the accounts scored as being of uncertain provenance and those that could not be scored posted tweets that were significantly more polarized and anti-vaccine. (Similarly, content polluters--malicious accounts identified as promoting commercial content and malware--posted significantly more anti-vaccine content.)

The Russian troll tweets exhibited the same strategy as the social-media influence campaign waged during the U.S. election--promote discord by playing both sides. Of the 253 tweets, 43% were pro-vaccine, 38% anti-vaccine and 19% neutral, with messages and conspiracy theories often tied to U.S. politics and government (e.g., At first our government creates diseases then it creates vaccines…).

Example vaccine-related tweets from Russian troll account identified by NBC News (from ajph.aphapublications.org/doi/10.2105/AJPH.2018.304567).
Wrap Up
Whether their tweets are pro- or anti-vaccine, Twitter bots and trolls have a significant presence in online communication about vaccinations. Unfortunately, the vaccine-related tweets may be from malicious actors with a range of hidden agendas. The Russian troll messages, for example, were clearly designed to sow society discord and erode public trust in vaccinations.

I hope you agree it was worth my reviewing this well-reported study. Thanks for stopping by.

P.S.
Study of Twitter bot and troll effect on vaccine discourse in American Journal of Public Health: ajph.aphapublications.org/doi/10.2105/AJPH.2018.304567
Example articles on study:
www.sciencedaily.com/releases/2018/08/180823171035.htm
www.cnn.com/2018/08/23/health/russia-trolls-vaccine-debate-study/index.html
www.washingtonpost.com/science/2018/08/23/russian-trolls-twitter-bots-exploit-vaccine-controversy/
www.theguardian.com/society/2018/aug/23/russian-trolls-spread-vaccine-misinformation-on-twitter
Bots and Trolls:
www.techopedia.com/definition/24063/internet-bot
en.wikipedia.org/wiki/Twitter_bot
www.techopedia.com/definition/429/troll

A version of this blog post appeared earlier on www.warrensnotice.com.

19 March 2019

Tweets Misreport Disasters

Twitter logo.
Welcome back. Do you tweet? I sometimes check friends’ tweets about technical news, but I don’t have a Twitter account. That’s not to say I didn’t consider joining the Twitter universe. After going around and around, I even shared my pros and cons in a 2013 blog post, Tweet?

For example, I wrote:
Pro: It’s like Facebook but better.
Con: It’s like Facebook.

I recently learned that I was wrong about one of my cons from that post:
Pro: I could learn what people are saying about almost any topic.
Con: Whoa! Learning what Twitter users are saying about a topic is probably reliable if I’m keeping up with Lady GaGa and useful if I’m monitoring a disaster or crisis. But Twitter users are only a subset of the population…and those who tweet aren’t a random sample of that population…

Although the part about Lady GaGa was right, a study by investigators from the University at Buffalo found Twitter users aren’t very good at judging or responding to potential rumors during disasters.

Tweeting Rumors
The researchers analyzed over 20,000 tweets sent during Hurricane Sandy in 2012 and the Boston Marathon bombings in 2013. They focused on two rumors from each disaster, examining Twitter users’ rumor and debunking response behaviors.

False rumor tweeted during Hurricane Sandy
(from www.dailymail.co.uk/news/article-2226188).
They found that, of the users who sent tweets:
- 5% to 9% tried to confirm the rumors,
- 1% to 9% expressed doubt, and
- 86% to 91% spread the rumors.

Topping it off, the researchers examined how the rumor-spreading tweeters responded to the news that the rumors were false. They found:
- 3% to 10% deleted their rumor-spreading tweet(s),
- 0% to 20% clarified the rumor information with a new tweet, and
- 78% to 97% neither deleted nor clarified their rumor-spreading tweet(s).

These breakdowns do not include Twitter users who may have seen and ignored the original tweets.

Wrap Up
The researchers note that, while many Twitter users went overboard to spread and not correct false information during the two disasters, Twitter moved quickly to correct the misinformation.

Though not addressed in the study, it should be clear that using Twitter or other social media to spread false or misleading information for, say, political purposes falls into a different category. Unfortunately, it’s become inescapable.

Thanks for stopping by.

P.S.
Study of Twitter users’ rumor response during disasters in Natural Hazards journal: link.springer.com/article/10.1007/s11069-018-3344-6
News release on study on University at Buffalo website: www.buffalo.edu/news/releases/2018/05/020.html

A version of this blog post appeared earlier on www.warrensnotice.com.

11 October 2013

Tweet?

Welcome back. Do you tweet or follow anyone who does? I’ve been told that I should open a Twitter account and tweet away. After hemming and hawing and giving profound consideration to the possibility for a year or two, I’ve come to the conclusion that I’m not sure. (You may recall that decisions aren’t my forte, Decision-Making Time.) 
 
Oops. Wrong bird for Twitter
 symbol. (photo from one on
 multiple websites)

If you’ve also delayed joining the Twitter universe or are new to thinking about it, you might be interested in the list of pros and cons I’ve compiled--at least the pros. The cons are more personal. You’re welcome to borrow any.

To Tweet or Not

Pro (P): Everyone is doing it--over half a billion people. Although 40% of Twitter users only read other peoples’ tweets, there are still over 9000 tweets per second.
Con (C): I don’t feel needed.

P: More and more celebrities and politicians are tweeting.
C: (Censored)

P: Twitter is an excellent way to share all the interesting things I do.
C: If I started tweeting, the global economy would be threatened when my expanding network of Twitter followers demanded more and more time off from work to read, retweet (RT) and translate (TT) my daily dose of the interesting things I do.

P: It’s like Facebook but better.
C: It’s like Facebook.

P: Twitter is a way to share my thoughts quickly.
C: I’d have to stop everything I’m doing for a week to count the times I’ve slipped, offended, gotten into trouble or otherwise bungled the message by sharing my thoughts quickly (i.e., with too little thought).

P: I could use Twitter to promote my blog.
C: The Retired--Now What? Blog is unpromotable; too many topics.

P: I would finally be an adopter of more social media technologies.
C: Huh?

P: I could use the same abbreviations I use when I text.
C: I’ll definitely remember that if I ever start texting.

P: Twitter is perfect for mobile phones.
C: And exactly how does that pertain to me?

P: I could learn what people are saying about almost any topic.
C: Whoa! Learning what Twitter users are saying about a topic is probably reliable if I’m keeping up with Lady GaGa and useful if I’m monitoring a disaster or crisis. But Twitter users are only a subset of the population of “people,” and those who tweet aren’t a random sample of that population. Worse, think of the time I’d need to read the tweets about a topic, especially about Lady GaGa, who has over 40 million followers.

P: Since I’m retired, it would give me something to do.
C: Since I’m retired, I’ve got better things to do.

P: News networks are tweeting breaking news.
C: Oh, great! More cryptic headlines and less news.

P: It would force me to write concisely.
C: A limit of 140 characters, including spaces, isn’t really that concise. With my technical writing background, I would have no difficulty con…

Wrap Up

Twitter came to mind because it recently filed for an initial public offering, but there are so many other possibilities. How about Tumblr, where my blogs could be micro? (Lady GaGa uses Tumblr.) Kik is out; I’d need a smartphone. Shapchat is all about photos and it’s too ethereal. I’m way too outdated for Pheed. As always, your kibitzing would be greatly appreciated. Use as many characters as it takes.

Thanks for stopping by.

P.S.

Twitter website and statistics:
twitter.com/
www.statisticbrain.com/twitter-statistics/

Help for potential Twitter users:
techland.time.com/2013/05/21/twitter-101-understanding-the-basics/?xid=newsletter-techland
www.jhische.com/twitter/
thenextweb.com/twitter/2012/09/15/a-list-twitters-language/
mashable.com/2013/07/19/twitter-lingo-guide/
techland.time.com/2013/09/13/5-surprising-things-you-can-find-on-twitter/?xid=newsletter-techland

Wikipedia’s list of social networking sites (not current):
en.wikipedia.org/wiki/List_of_social_networking_websites