Showing posts with label Education - Learning. Show all posts

20 October 2023

Teachers Feel Overworked, Underpaid

Teachers need help (from www.weareteachers.com/principals-support-teachers/).
Welcome back. In late August, I released a blog post, Teachers’ Views on Safety. The post highlighted a national survey of K-12 teachers conducted in 2022 by the Rand Corporation, a non-partisan, nonprofit global policy think tank, research institute.

For a recently published 28-page report, in early 2023, Rand surveyed public-school teachers on how salary and work hours affected their well-being and intent to leave their jobs. To provide context, the researchers also surveyed U.S. non-teacher working adults.

Teachers’ well-being and job-related stress appeared to have returned to pre-pandemic levels. In some states, however, more teachers left their jobs at the end of the 2021–2022 school year than in the two previous school years at rates higher than pre-pandemic averages.

Survey Data
Rand researchers used data from three sources: the 2023 State of the American Teacher (SoT) survey, a nationally representative survey of 1,439 K-12 public school teachers; the 2023 American Life Panel (ALP) companion survey, a nationally representative parallel survey of 527 working adults; and the 2021 and 2022 administrations of the SoT and ALP companion surveys. Black and Hispanic teachers were oversampled in the 2022 and 2023 SoT surveys to allow for representative estimates of teachers in these groups.

Hours Worked

Hours that teachers worked during the school year were measured by surveying:
-total hours worked per week before and after school and on weekends on teaching and other school-related activities,
-total contracted hours worked in a typical week at their current school in accordance with the teacher’s contract, and
-total hours worked for extra pay on school-related activities for which the teacher received extra pay during a typical full week at their current school.

Also surveyed were the hours that working adults other than teachers worked in a typical full week since September 2022, including any unpaid or overtime paid hours.

Hours worked per week reported by teachers and other working adults (*percentage for subgroup differs at a significance level of 0.05 from the reference group); (fig. 1, from www.rand.org/pubs/research_reports/RRA1108-9.html).

Earnings
Teachers were asked to report their base teaching salary for the school year, how adequate they considered that salary to be, and if inadequate, to report the desired base salary. Teachers were not asked the total amount they made during the school year with benefits, any extra school pay or non-school work. 

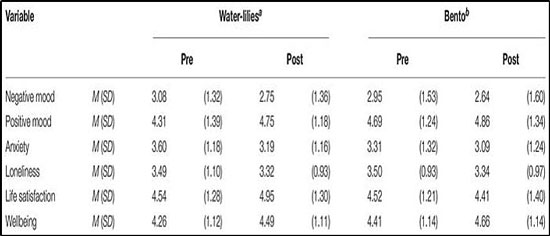
Teachers’ and other working adults’ satisfaction with pay, hours worked and selected working conditions (YOE, years of experience; *percentage for subgroup differs at a significance level of 0.05 from the reference group); (table 1, from www.rand.org/pubs/research_reports/RRA1108-9.html).
Work-Place Factors
The researchers asked teachers their perceptions of, and satisfaction with, five work-place factors: total hours worked weekly during the school year, base salary, administrator support; relationships with other teachers and well-being support provided by their employers, health insurance or professional association.

Well Being
Five indicators of well-being were surveyed: frequent job-related stress; difficulty coping with job-related stress; symptoms of depression, burnout and resilience.

Key Results
On average, teachers reported working 53 hr/wk during the school year, though nearly all were contracted to work 40 hr/wk or less. That 53 hr/wk was 7 hr/wk more than the average reported by non-teacher working adults. (Notably, these hours per week were about the same as those throughout the pandemic.)

Digging deeper, 88% of teachers reported working more than 40 hr/wk compared with 47% of non-teacher working adults. Nearly half of the teachers worked more than 50 hr/wk and 16% more than 60 hr/wk.

On average, Black and Hispanic teachers worked more hours per week than their White counterparts, received slightly lower base salaries, and were less satisfied than White teachers with their base salary.

Wrap Up
Most teachers feel overworked and underpaid, working more hours per week, on average, than non-teacher working adults, with 1 out of every 4 hours worked per week being uncompensated.

Low salary and long working hours were the top-ranked reasons why teachers were considering leaving their jobs as well as commonly reported job-related stressors.

Percentage of teachers who are considering leaving who selected each reason as one of their top five reasons (error bars depict 95% confidence intervals for each estimate; *percentage for subgroup differs at a significance level of 0.05 from the reference group);  (fig. 7, from www.rand.org/pubs/research_reports/RRA1108-9.html).

The researchers conclude that pay increases alone, without improvements in working hours or conditions, are unlikely to induce large shifts in teachers’ well-being or intentions to leave.

Thanks for stopping by.

P.S.

Rand report on teachers’ perceptions of pay and hours worked: www.rand.org/pubs/research_reports/RRA1108-9.html
Article on report on EurekAlert! website: www.eurekalert.org/news-releases/1001025


01 September 2023

Peanut Allergy Update

Welcome back. As a scientist with the Federal Government, I regularly functioned as a Contract Officer’s Technical Representative managing a slate of research projects. On one occasion, a group of us were meeting with a new contract officer. She entered the room with an armload of folders, introduced herself and announced that she was very allergic to peanuts.

Though I’ve encountered many people with asthma and different allergies, including my own bouts of hay fever, which ended years ago (see Time for Allergies), that was my only direct experience with peanut allergy.

Possible symptoms of peanut allergy (taken from list in
 www.linkedin.com/pulse/symptoms-peanut-allergy-brian-w-wu-phd
).
US Statistics
In the US, peanut allergy is rated the most common food allergy in children and one of the most common food allergies in adults, affecting about 2% of the both populations.

A 2021 study by researchers with Northwestern University and the Mount Sinai School of Medicine found that approximately 4.6 million US adults are allergic to peanuts; more than 800,000 of whom appear to have developed the allergy after age 18.

Prevention Guidelines
Possibly the most important news about peanut allergy came in 2017. An expert panel, sponsored by the National Institute of Allergy and Infectious Diseases, released the Addendum Guidelines for the Prevention of Peanut Allergy in the United States.

Introducing peanut-containing foods into the diets of infants at various risk levels for peanut allergy (cover photo of www.niaid.nih.gov/sites/default/files/addendum-peanut-allergy-prevention-guidelines.pdf).

The addendum provided three separate guidelines for early introduction of peanut-containing foods into the diets of infants at various risk levels for peanut allergy. The guidelines, intended for use by health care providers, addressed risk categories, appropriate use of testing, and the timing and approaches to introduce peanut-containing foods in the health care provider's office or at home.

Guidelines Status Report
Researchers with Northwestern University and the Ann & Robert H. Lurie Children’s Hospital of Chicago recently published a study, which involved the first nationwide survey of the impact and implementation of the addendum guidelines.

The survey was administered between January and February 2021 to a population-based sample of 3,062 US parents/caregivers of a child age 7 months to 3.5 years.

Survey Responses
The survey found 13.3% of respondents were aware of the Prevention of Peanut Allergy Guidelines. Those more likely to be aware were white, 30 to 44 years old, educated, high income or caring for a child with food allergy or eczema.

Whether they were aware of the guidelines or not, 47.7% of survey respondents believed that feeding peanuts early prevented peanut allergy; 17.2% first offered peanut-containing foods before age 7 months, 41.8% did so between ages 7 and 12 months. Peanut introduction occurred earlier among guidelines-aware parents/caregivers; 31% began before 7 months.

Overall, 57.8% of respondents reported discussing peanut introduction with their primary care provider. The providers’ counseling was the most common facilitator for peanut introduction before 7 months,

Fear of reactions was the most common reason for delaying peanut introduction beyond 7 months (32.5%). Yet only 1.4% of respondents reported infant and child reactions during peanut introduction. The reactions were mostly dermatological (e.g., a rash) or gastroenterological (e.g., vomiting). Previous studies have found that, on average, infant reactions are much milder than older children’s reactions.

Wrap Up
The researchers concluded that early peanut introduction is gaining traction among US parents/caregivers; however, disparities exist. Efforts to increase guidelines adherence need to:

- Address care barriers and systemic racism that make information less known to non-white, less-educated and lower-income parents.
- Support medical providers to make information available in a timely way.
- Educate the public about reactions to peanuts, the main fear reported in the survey.

While my former contract officer and other adults will need a different approach, at least peanut allergy in children can be substantially reduced. Thanks for stopping by..

P.S.
US allergy statistics in Allergy & Asthma Network: allergyasthmanetwork.org/allergies/allergy-statistics/
Study of peanut allergy in US adults in The Journal of Allergy and Clinical Immunology: www.jacionline.org/article/S0091-6749(20)32412-X/fulltext

Addendum Guidelines for the Prevention of Peanut Allergy in the United States: www.niaid.nih.gov/sites/default/files/addendum-peanut-allergy-prevention-guidelines.pdf
Study of peanut introduction in Pediatrics journal: publications.aap.org/pediatrics/article-abstract/doi/10.1542/peds.2022-059376/192815/Early-Peanut-Introduction-Awareness-Beliefs-and?redirectedFrom=fulltext
Article on study on EurekAlert! website: www.eurekalert.org/news-releases/996256

25 August 2023

Teachers’ Views on Safety

Welcome back. The Rand Corporation conducted a national survey of K-12 teachers’ views of school safety in October and November 2022. That was five months after the Uvalde school shooting and a period during which some 17 shootings occurred at K–12 schools in 14 different states. Rand’s 28-page report was released a few months ago. I just wasn’t ready to blog about the topic. My time’s up.

The survey covered the teachers’ main safety concerns, perceptions of security measures in place, the effect of those measures on school climate, and whether they were concerned for their own safety and that of their students.

The survey also asked whether allowing teachers to carry firearms would make schools more or less safe and whether they would carry a firearm if given the choice.

I’ll describe the survey, then highlight selected responses.

The Teacher Survey

RAND researchers surveyed a random sample of 973 K–12 teachers using the American Teacher Panel, which consists of more than 25,000 U.S. teachers.

Because teachers’ exposure to school violence might vary with school context, survey responses were categorized by both teacher characteristics--gender and race/ethnicity--and school characteristics--locale, racial/ethnic composition, poverty level, grade level and enrollment.

The sample’s responses were statistically weighted to estimate K-12 public school teacher responses across the country.

Some Key Findings

Bullying: Despite the growth in gun violence, bullying was the teachers' most common safety concern at all grade levels.

Estimated percentages of teachers who said that various school safety topics pose the greatest safety concern at their schools (Fig. 9 from www.rand.org/pubs/research_reports/RRA2641-1.html).

School Security Measures: Nearly all teachers surveyed worked in schools that had at least one of the eight security measures listed on the survey. The most common were visitor systems, exterior and interior locks and staff IDs, followed by dedicated security staff and/or security cameras. Roughly half of teachers felt the security measures had a positive effect on school climate; only 5% of teachers felt their schools' security measures had a negative effect.

Arming Teachers: Similar to older and state-specific surveys, the Rand survey found that teachers are divided about arming teachers. Although only 20% believed it would make schools safer, the divisions varied with teacher gender and race/ethnicity as well as with school characteristics. 

Estimated percentages of teachers who reported believing that having teachers carry firearms for school security would make schools more or less safe (Fig. 1 from www.rand.org/pubs/research_reports/RRA2641-1.html).

Teachers Who Would Carry Firearms: An estimated 19% of surveyed teachers would choose to carry a firearm if their school implemented a program allowing teachers to be armed. That varied significantly with gender and school locale. All told, an estimated 550,000 of the country's 3 million K–12 teachers would choose to carry a firearm at school if allowed.

Estimated percentages of teachers who would choose to carry a firearm if their school implemented a program allowing teachers to be armed (Fig. 2 from www.rand.org/pubs/research_reports/RRA2641-1.html).

Teachers’ Concern About Self and Students: Regardless of their school characteristics, roughly 1 in 5 teachers was worried about being the victim of an attack at their school. To be clear, however, the teachers reported more concern about their students’ safety. Roughly 1 in 3 teachers worried that their students would be victimized at school, and that concern was particularly high among teachers in secondary schools, high-poverty schools and schools located in urban areas.

Wrap Up
As you would expect, the report offers a great deal of detailed information, including several recommendations, such as: Identify how fears of victimization and of specific safety concerns contribute to teacher and principal turnover, and to student enrollment, attendance, and academic performance.

Thanks for stopping by.

P.S.
Rand report on teachers' views of school safety: www.rand.org/pubs/research_reports/RRA2641-1.html
Article on report on EurekAlert! website: www.eurekalert.org/news-releases/990310

23 September 2022

Online Art Viewing

Welcome back. To make amends for not blogging about art in years, I have two studies to review. Although the two are quite different, both focus on appreciating how viewing art can improve wellbeing--even when the viewing is virtual. I hope you’ll find them of interest.

Viewing Art and Non-Art
Researchers with Austria’s University of Vienna, Germany’s Max Planck School of Cognition, and Netherland’s Max Planck Institute for Psycholinguistics examined how online art and cultural engagements impact mental states.

They recruited 84 participants (65 women, 17 men, 1 other, 1 unknown; average age 35, ranging from 21 to 74; from the Americas, 48%, Europe, 43%, Asia, 8% and Africa, 1%), and exposed 40 to an “art” condition, 44 to a “non-art” condition.

Both conditions, taken from Google Arts and Culture, consisted of single online images whose visual details could be zoomed in on and related text.

The “art” condition drew upon an exhibition of Monet’s The Water Lily Pond from the National Gallery, London. 

Claude Monet’s “The Water Lily Pond” (from artsandculture.google.com).
The “non-art” condition was A Bitesize History of Japanese Food; Explore a mouthwatering box of Japan’s iconic cuisine, which included a diagram in the shape of a bento box, containing photos and facts on the history and traditions of Japanese food.

"A Bitesize History of Japanese Food" (from artsandculture.google.com).
Assessing the Effects
A pre-study survey collected participants’ demographic and life status, personality traits and art interest and expertise.

To measure the impact of viewing the online conditions, the researchers assessed six wellbeing dependent variables in both pre- and post-viewing surveys: (1) De Jong Gierveld 6-Item Loneliness Scale; (2) State-Trait Anxiety Inventory; (3) Satisfaction with Life scale; (4) Subjective Wellbeing scale; and (5,6) two questions to rate positive and negative mood.

The Findings
On average, participants engaged with each condition for only about 1.5 to 2 minutes, describing the experience in similar positive-valence emotions and cognitive states (e.g., serenity, happy, stimulated, insight), with low levels of negative emotions (e.g., fear, embarrassed, anger).

Overall, the study found a significant impact on several wellbeing variables. The researchers concluded that online cultural engagement, including but not limited to fine art, appears to be a viable approach to support individuals’ mood, anxiety, loneliness and wellbeing, especially when the content is beautiful, meaningful and inspiring to the viewer.

Average self-reported ratings (means and standard deviations) for each time condition per group; number of participants, a = 36, b = 42; for a positive impact, negative mood, anxiety and loneliness should decrease while positive mood, life satisfaction and wellbeing should increase (from Table 1, www.frontiersin.org/articles/10.3389/fpsyg.2022.782033/full).
Online Museum Tours
Research has shown that older adults' wellbeing and quality of life are negatively impacted by both social isolation and frailty; the latter is defined as an aging-related syndrome of physiological decline, characterized by marked vulnerability to adverse health outcome. A team of investigators, led by a researcher with the University of Montreal, joined with the Montreal Museum of Fine Arts to gauge the potential benefits of online museum tours.

Montreal Museum of Fine Arts (museesmontreal.org/en/museums/montreal-museum-of-fine-arts).
They screened and ultimately enlisted 106 Montreal community dwellers aged 65 and over, randomly assigning half to a 3-month cycle of weekly online museum tours and half to be held as control, abstaining from any cultural activities.

Each online 45-minute museum visit was performed with 6 to 8 participants and a trained guide, for a total of 8 groups. The visits included presentation of objectives, a dialogic-style tour with trained museum guides, and open-ended discussion. The tour content consisted of artwork, live discussions animated by tour guides, ancillary information on the artwork or artists from tour guides, and videos about specific works or artists.

Assessing the Effects
Social isolation, wellbeing, quality of life and frailty were assessed for both groups using validated scales at baseline (M0) and after 3 months (M3). The museum tour group showed significant improvements in social isolation, wellbeing, quality of life and especially frailty scores compared to the control group.

Mean (standard deviation) changes in frailty of control and tour groups from baseline to 3 months; calculated from questionnaire providing a score ranging from 0 (vigorous) to 18 (severe frailty) (from Table 2, www.frontiersin.org/articles/10.3389/fmed.2022.969122/full).

The study suggests that a 3-month cycle of weekly online museum tours may foster a sense of connectedness and thereby improve mental and physical health in community-dwelling older adults.

Wrap Up
Living within a metro ride to Washington D.C. for over 20 years afforded the opportunity to visit the National and other museums. How often did we take advantage of it? Would online viewing have made a difference? Would it have improved our wellbeing? I’ve got to think about that, especially now that I’m retired and those museum are far away. How about you?

Thanks for stopping by.

P.S.
Study of online art and non-art viewing in Frontiers in Psychology journal: www.frontiersin.org/articles/10.3389/fpsyg.2022.782033/full
Article on study on EurekAlert! website: www.eurekalert.org/news-releases/958286

Google Arts & Culture:
artsandculture.google.com
en.wikipedia.org/wiki/Google_Arts_%26_Culture

Study of online museum tours in Frontiers in Medicine journal: www.frontiersin.org/articles/10.3389/fmed.2022.969122/full
Article on study on EurekAlert! website: www.eurekalert.org/news-releases/961581

29 April 2022

Youths Happier During Lockdown

Welcome back. Among the interesting studies published during my hiatus was one from researchers with Cambridge and Oxford universities. They found the self-reported mental health and wellbeing of 1 in 3 youths improved during England’s first COVID-19 lockdown. 

Self-reported change in mental wellbeing of 16,940 youths during England’s first COVID-19 lockdown (from link.springer.com/article/10.1007/s00787-021-01934-z).
Improved? Wait. That’s not what I’ve been hearing and reading. Has the media overstated the issue? Here’s what the U.S. Surgeon General wrote on 7 December 2021:

Before the COVID-19 pandemic, mental health challenges were the leading cause of disability and poor life outcomes in young people, with up to 1 in 5 children ages 3 to 17 in the U.S. having a mental, emotional, developmental, or behavioral disorder…

The pandemic added to the pre-existing challenges that America’s youth faced…This Fall, a coalition of the nation’s leading experts in pediatric health declared a national emergency in child and adolescent mental health.

The UK study doesn’t detract from the crisis, it simply adds perspective: not every youth got worse. Determining why one-third fared better might provide insight for promoting youth mental health and wellbeing going forward.

Data for Analysis

The researchers used data from the OxWell Student Survey, a recurring, cross-sectional, self-report survey relating to mental health and wellbeing. The school-base survey of England’s students, aged 8 to 18, contains questions repeated in each iteration as well as new questions added in response to social and environmental events and emerging research.

For the current study, 16,940 students were surveyed June-July 2020 at the tail end of England’s first national lockdown. They answered questions about their experiences with the pandemic, school, home, lifestyle, relationships and more.

Examining the Data
The study was limited to a descriptive analysis of data, which is probably sufficient to highlight major differences without resorting to statistical testing. Descriptive analysis is also the simplest way for me to summarize key findings from the reported results.

Toward that end, I’ve prepared a table relating the youths’ self-reported changes during the lockdown to the number of those whose mental wellbeing got better, worse or remained the same. I’ve listed 14 items derived from a table the researchers reported with over 100 items. This is not to say the reported detail wasn’t significant; only that it’s well beyond the scope of what I needed to capture some core findings. I encourage you to review the paper to pursue the topic in greater depth. 

Relationships of selected variables with self-reported change in mental wellbeing of 16,940 youths during England’s first COVID-19 lockdown (modified from Table 2 of link.springer.com/article/10.1007/s00787-021-01934-z).
Overall, the mental wellbeing of surveyed males and younger students tended to improve during the lockdown while surveyed females and older students tended to get worse.

The students whose mental wellbeing improved during the lockdown self-reported that they were able to get all the academic help they needed at home, managed school tasks better, were bullied a little less, had better relationships with friends and family, felt less left out and less lonely, and exercised as well as slept more.

Wrap Up
As the researchers point out, the survey showed that students who reported improved mental health and wellbeing were more likely than their peers to report improvement across the full range of school, relational and lifestyle factors.

The impact of lockdown was dependent on a number of factors, such as gender, pre-pandemic mental health, social relationships, school connectedness, online learning experience, family composition and family financial situation.

While the crisis is real, many students did indeed experience improved mental health and wellbeing. Thanks for stopping by.

P.S.
Study of UK students during lockdown in European Child & Adolescent Psychiatry journal: link.springer.com/article/10.1007/s00787-021-01934-z
Article on study on EurekAlert! website: www.eurekalert.org/news-releases/944267
U.S. Surgeon General’s advisory: www.hhs.gov/about/news/2021/12/07/us-surgeon-general-issues-advisory-on-youth-mental-health-crisis-further-exposed-by-covid-19-pandemic.html
Oxwell Student Survey and information for parents:
bmjopen.bmj.com/content/11/12/e052717
www.psych.ox.ac.uk/research/schoolmentalhealth/parent-information-sheet-1

13 November 2020

Fatal Police Shootings

Welcome back. Living in the D.C. area for more than 20 years, I was a regular reader of The Washington Post. I still see selected articles, but most of the content goes by. I wasn’t aware, for example, that the newspaper started logging every fatal shooting in the U.S. by an on-duty police officer.

The Post began that project after its investigation of the 2014 shooting of Michael Brown, Jr., in Ferguson, Mo., found the FBI undercounted fatal police shootings by more than half. Reporting by police departments is voluntary and many don’t.

The Post’s “Fatal Force” database begins on 1 January 2015; relies primarily on news accounts, social media postings and police reports; is updated as new information is obtained; and is searchable by state, gender, race, age, mental illness, weapon, body camera, fleeing the scene, year, as well as name.

The Washington Post’s database of fatal shootings by on-duty police officers (from www.washingtonpost.com/graphics/investigations/police-shootings-database/).
Although The Washington Post makes the database available publicly, a team of medical researchers affiliated with Penn, Yale and Drexel universities judged it was critical that fatal police shootings of Black, Indigenous and People of Color (BIPOC) be recognized and treated as a public health emergency. Toward that end, they decided to enter the data into the scientific literature and present it using methods that are accepted by science as rigorous and robust.

Relative Rates of Fatal Police Shootings
For their recently published study, the researchers conducted a longitudinal analysis of 4,653 of the 5,367 fatal police shootings listed through May 2020, omitting those lacking race/ethnicity or age details.

Using generalized linear-mixed models to capture trends with time and rates relative to respective populations, they found shootings of BIPOC, whether armed or unarmed, were essentially constant from 2015 to 2020 and significantly higher than that of Whites. 

Fatal U.S. police shootings by ethnicity, 1 Jan 2015–14 July 2020; graphic’s end date is several weeks after that of study (The Washington Post data; www.statista.com/chart/21857/people-killed-in-police-shootings-in-the-us/).
For armed victims, the rates that Native Americans, Blacks and Hispanics were killed were, respectively, 3 times, 2.6 times and 1.3 times higher than the rate Whites were killed. For unarmed victims, the rates that Blacks and Hispanics were killed were, respectively, 3 times and 1.4 times the rate of Whites. The average age of Whites killed was 38; Native Americans, Blacks and Hispanics were younger, 31, 30 and 33, respectively.

Years of Life Lost
The researchers also calculated the estimated years of life lost by race/ethnic group. Basing the estimates on national historical life expectancy data for U.S. citizens in the victim's birth year vs. age at death, they found an average 31,960 years of life lost annually due to police shootings. Relative to Whites, the years of life lost were 4 times higher for Native Americans, 3.3 and 3.5 times higher for Blacks overall and unarmed, and 1.6 times higher for Hispanics overall and unarmed.

Another, more difficult factor to quantify is that Blacks report worse mental health in areas where there are police killings.

A center-of-the-road memorial to Michael Brown, Jr., for the 5th anniversary of his fatal shooting by a police officer, 9 Aug 2014; the neighborhood memorial was in place on 8 Aug and will be guarded overnight by the man in the folding chair (photo by Robert Cohen for St. Louis Dispatch, rcohen@post-dispatch.com).
Wrap Up
Why should the number of fatal police shootings be almost the same, nearly 1,000, every year since the Post started its tally? The database website points to probability theory for a possible explanation. In essence, the quantity of rare events in huge populations tends to remain stable absent major societal changes. For police shootings, that change could involve a fundamental shift in police culture or restrictions on gun ownership.

Treating the shootings as a public health emergency, the researchers note that what has been done at the local level--body cameras and independent investigations--is insufficient. It must be raised to the state and national level and codified into law.

So, should it be more Law and Order, more Black Lives Matter or…well, what do you suggest? Thanks for stopping by.

P.S.
The Washington Post “Fatal Force” website: www.washingtonpost.com/graphics/investigations/police-shootings-database/
Study of fatal police shootings in Jour. of Epidemiology & Community Health: jech.bmj.com/content/early/2020/10/20/jech-2020-215097
Articles on study on EurekAlert! and Yale University websites:
www.eurekalert.org/pub_releases/2020-10/b-fps102320.php
news.yale.edu/2020/10/27/racial-disparity-police-shootings-unchanged-over-5-years
CDC’s definitions of years of potential life lost: www.cdc.gov/injury/wisqars/fatal_help/definitions_ypll.html

11 October 2019

Climate-Change Facts Missing

Welcome back. Not long ago, I interrupted a conversation about climate. It happened during the Saturday morning coffee klatch (Saturday Coffee Hour).

Months earlier, I had talked about carbon dioxide and climate change with different Saturday morning attendees. This latest incidence was back to square one. It began when I heard something along the lines of climate change is all politics, climate is always changing.

News about climate change has finally made it to prime time and the front page. Most people now accept that climate is warming, even if they still don’t get it.

CBS News poll of Americans on the gravity of climate change; Sep 2019 survey by YouGov (from www.cbsnews.com/news/cbs-news-poll-most-americans-say-climate-change-should-be-addressed-now-2019-09-15/).
A recent study by researchers from the University of California, Berkeley, concludes that journalists could do more; that they have failed to present key facts to educate the public. While that study’s findings are reliable, there’s a lot of noise to overcome.

Why Don’t They Understand?
Polls show that whether Americans agree or disagree that human activity affects climate, they lack an understanding of the facts.

The Berkeley researchers identify five basic climate facts people need to know, and they investigate how often those facts were conveyed in The New York Times news articles on climate change from 1980 to 2018.


The five facts are: climate change is occurring, its cause, there is a scientific consensus, the magnitude of the problem and the timescale of the resulting harm. 
The five climate-change facts searched for in The New York Times articles, 1980 to 2018; alternative or optional wording in parentheses (from iopscience.iop.org/article/10.1088/2515-7620/ab37dd).
A single newspaper, The New York Times, was chosen for analysis since the Times’ reputation and excellence in reporting environmental issues would place something of an upper bound on newspaper climate coverage.

The Times Search
The researchers’ search of the ProQuest US Major Dailies database from 1980 found 1,801 Times articles with “global warming,” “climate change” or “greenhouse effect” in the title.

Reducing these to standard, non-duplicative news articles (e.g., removing op-eds) of at least 500 words, they arrived at 597 articles.

A computer algorithm was devised to screen the 597 articles for character strings that conveyed any of the five climate facts. The identified articles were read to confirm the fact was present.

Newspapers Should Do More
The analysis found that the vast majority of climate-change news articles contained none of the five basic climate facts.

The one exception, that global warming is happening now, appeared in 31% of Times news articles. The mechanism of global warming appeared with a similar frequency in the early 1980s but is rarely reported today. Similarly, scientific consensus, highest CO2 concentrations and global warming permanence are also seldom reported.

Percentage of climate change articles in The New York Times since 1980 that mention five climate facts (graphic by David Romps from iopscience.iop.org/article/10.1088/2515-7620/ab37dd).
Presuming that other major newspapers don’t do much better, the researchers conclude that newspaper articles on climate change lack the scientific context readers need to make sense of the problem.

But Who Reads Newspapers?
The newspaper industry has been in decline since the mid-2000s. According to the Pew Research Center, the estimated total U.S. daily newspaper circulation (print and digital) in 2018 was 28.6 million for weekday and 30.8 million for Sunday, down 8% and 9%, respectively, from 2017.

By 2017, more Americans were getting news from social media than from print newspapers, though in 2018, television was still the most popular news platform.

Pew Research Center survey of where U.S. adults often get news, 2018 (from www.pewresearch.org/fact-tank/2018/12/10/social-media-outpaces-print-newspapers-in-the-u-s-as-a-news-source/).
Unfortunately, television hasn’t done much to educate the public. When I was still in academia and colleagues were recognizing and modeling climate change elements, the fossil fuel industry led the campaign to spread misinformation and sow doubt about global warming. Now, there’s talk radio and Fox News, the most watched TV cable network.

Wrap Up
I often watch certain Fox newscasts; I’m always impressed by the Fox News tape at the bottom of the screen. An analysis of Fox News TV transcripts during the first half of 2019 found that, of the 391 times “climate change” or “global warming” was mentioned, 247 involved considerable discussion. Of these, 212 (86%) were dismissive, undermining climate science, action and advocacy.

Fox News commonly framed climate change as a political construct, suggesting global warming is a vehicle for the Democrats’ big-government agenda, that responding to the climate change would kill our economy and that concern about climate is liberal hysteria.

Hmmm…that sounds like the Saturday morning conversation I interrupted. We’re running out of time. Thanks for stopping by.

P.S.
U.C. Berkeley study of NY Times news articles on climate in Environmental Research Communications journal: iopscience.iop.org/article/10.1088/2515-7620/ab37dd
ProQuest News portfolio: www.proquest.com/libraries/academic/news-newspapers/
Pew Research Center’s Newspapers Fact Sheet: www.journalism.org/fact-sheet/newspapers/
Pew Research Center report on watching vs reading news: www.journalism.org/2018/12/03/americans-still-prefer-watching-to-reading-the-news-and-mostly-still-through-television/
Public Citizen analysis of Fox News: www.citizen.org/article/foxic-fox-news-networks-dangerous-climate-denial-2019/

28 June 2019

Exploring Wisdom

Welcome back. If you’re in the mood to ponder, try this: Can wisdom be increased? Before you rush ahead, realize that increasing academic skills does not necessarily increase wisdom.
The Data, Information, Knowledge, Wisdom (DIKW) Pyramid (modified from Contemplating Skill-Based Authentication www.saiee.org.za/DirectoryDisplay/AfricaResearchJournalArticle.aspx?ArjJournalListingId=8394).
Maybe I should start by defining wisdom. Or even better, I’ll review how researchers from the University of California San Diego addressed the topic.

Defining Wisdom
Religious and philosophical discussions of wisdom began long, long ago, yet empirical studies of the topic date only to the 1970s. The researchers take the approach that wisdom is a high-level quality that is useful for optimal functioning in society.

Drawing upon an in-depth review, they define wisdom as a complex human trait with several specific components: social decision making, emotion regulation, prosocial behaviors, self-reflection, acceptance of uncertainty, decisiveness and spirituality.

Proposing a Neurobiological Basis
Going further, they assign the defined components of wisdom to areas of the brain, chiefly the prefrontal cortex and limbic striatum. Selection of these locations is based on current understanding of neurobiology. For example, research has linked the prefrontal cortex with character, the limbic striatum has been linked with temperament and spirituality appears to involve these as well as other locations.

Examples of proposed links between brain’s neuroanatomical locations (left) and components of wisdom (excerpt from figure in journals.lww.com/hrpjournal/Fulltext/2019/05000/The_Emerging_Empirical_Science_of_Wisdom_.1.aspx).
More broadly, research suggests that wisdom is associated with health, well-being, happiness, life satisfaction and resilience. Most studies also suggest that wisdom or its components increase with age. Despite the loss of fertility and decline in health, older adults help to enhance their offspring’s well-being and longevity, facilitating a possible evolutionary role in fitness of the species.

Model of Development of Wisdom
To lay the groundwork for future work, the researchers propose a model of how wisdom develops in response to genetic, epigenetic and environmental influences.

In a brief outline of their model:
- Specific genes may increase the tendency for wisdom.
- Family or societal support influence development of wisdom components.
- These genetic and environmental influences are further affected by changes with aging, while epigenetic changes are impacted by life experiences and lifestyle.
- Aging also affects brain structures and connections within the wisdom neurobiology.
- Together, these influences may contribute to stronger and more balanced functioning of the prefrontal cortex and limbic striatum and greater wisdom.
- Such benefits feedback to sustain pro-wisdom genes and environments.

Wrap Up

So, can wisdom be increased? The researchers offer reasons to support that it can.

Traits such as resilience and optimism have been found to be moderately heritable, which suggests they can be influenced by environmental factors.

Specifically located brain trauma or disease, such as frontotemporal dementia, can diminish wisdom, which suggests the possibility that wisdom might be enhanced through biological or behavioral interventions of those brain regions.

Further, given that the components of wisdom overlap and are interrelated, improving one component may improve others.

Overall, the researchers emphasize the need to expand empirical research on wisdom given its largely untapped potential for enhancing mental health of individuals and promoting well-being of society. 


Thanks for stopping by and pondering.

P.S.
Study of wisdom in Harvard Review of Psychiatry: journals.lww.com/hrpjournal/Fulltext/2019/05000/The_Emerging_Empirical_Science_of_Wisdom_.1.aspx
Article on study on EurekAlert! website: www.eurekalert.org/pub_releases/2019-05/wkh-bwi051419.php

31 March 2019

Who Knows GMOs?

Welcome back. In an earlier blog post (Science and Society), I highlighted Pew Research Center surveys from 2014 that measured agreement with several statements, including It’s safe to eat genetically modified foods.

At the time, 88% of U.S.-based scientists agreed with the statement compared with only 37% of the U.S. public.

The 10 genetically modified crops available in the U.S.: corn (field and sweet), soybeans, cotton, canola, sugar beets, alfalfa, papaya, squash, apples and potatoes (from gmoanswers.com/current-gmo-crops).
While those surveys set a marker for scientists versus the general public, Pew surveys of the American public in 2016 and 2018 found those who believe genetically modified (GM) foods are unhealthier than non-GM foods increased from 39% to 49%.

Scientists weren’t surveyed separately, yet additional survey questions established that the increased concern about GM foods was primarily from those with low levels of science knowledge. There was essentially no change from those with high science knowledge.

Comparison of 2016 and 2018 Pew Research Center surveys of U.S. adults regarding health effects of genetically modified foods, categorized by respondents’ science knowledge (from www.pewresearch.org/science/2018/11/19/public-perspectives-on-food-risks/).
Given those results, I suppose we shouldn’t be too surprised that a recent study found the most extreme opposition to GM foods was from those who think they know the most--but actually know the least--about GM food science.

I’ll review that study after a look at GM foods.

Genetically Modified Organisms and Foods
Genetically modified organisms (GMOs) are plants, animals and microorganisms whose genetic material (DNA) has been altered in a way that does not occur naturally or through traditional crossbreeding. Selected genes are transferred from one organism into another or between unrelated species. The goal is to proffer some advantage, such as crop protection from disease or insects.

Foods produced from or using GMOs are referred to as genetically modified or genetically engineered foods.

The scientific consensus is that GM foods pose no greater risk to human health than conventional foods and can provide substantial benefits, but that each GM food needs to be tested before it’s introduced.

GM food safety testing normally covers direct health effects (toxicity, allergenicity), specific components thought to have nutritional or toxic properties, stability of the inserted gene and any unintended effects of gene insertion.

Characterizing U.S. GM Food Opponents
The assessment of extreme opponents to GM food was conducted by a team of researchers from the University of Colorado, Boulder, Washington University in St. Louis, the University of Toronto and the University of Pennsylvania.

They initially surveyed a representative sample of 501 U.S. adults asking two questions about GM foods: opposition (1-none to 7-extreme) and concern (1-none to 7-extreme).

Next, they asked participants to rate their understanding of GM foods (1-vague to 7-thorough).

Finally, they tested the participants’ scientific literacy with 15 true-false questions drawn from such sources as the American Association for the Advancement of Science Benchmarks for Science Literacy. Five of the 15 items concerned genetics (e.g., All plants and animals have DNA).

The results showed that as opposition to and concern about GM foods increase, knowledge about science and genetics decreases; however, perceived understanding of GM foods increases. In other words, extreme opponents know the least, but think they know the most.

International GM Food Opponents
The researchers conducted a parallel assessment using nationally representative samples from France (500 participants), Germany (519) as well as the U.S. (540).

Objective genetics knowledge was measured with 10 true-false questions. Self-assessed knowledge was measured by asking, “How much do you know about genetically modified food?” (1-not at all to 5-a great deal).

Extremity of opposition was measured by averaging across 12 items that encompassed reluctance to buy, desire to regulate and willingness to oppose GM products, for example, through public demonstration.

The results were similar to the initial U.S. assessment. Across the entire sample, and controlling for country, extremity of opposition and self-assessed knowledge increase as objective knowledge decreases.

Predicted relationships between extremity of opposition and both objective and self-assessed knowledge by country; shading represents the 95% confidence interval (from www.nature.com/articles/s41562-018-0520-3).
Wrap Up
Although the study focus was on GM foods, the researchers also surveyed for concern about and belief in human-caused climate change. The direction of the effects was the same, but the results were not statistically significant.

Unlike beliefs about GM foods, whose opposition was shared by liberals, moderates and conservatives, climate change beliefs were highly polarized by political identification. Conservatives were much more likely to oppose the scientific consensus. The researchers posit that, for highly politicized issues, ideological commitments may supersede individual knowledge.

Thanks for stopping by.

P.S.
Pew survey of public perspectives on food risks: www.pewresearch.org/science/2018/11/19/public-perspectives-on-food-risks/
Background on GM foods:
en.wikipedia.org/wiki/Genetically_modified_food
www.who.int/foodsafety/areas_work/food-technology/faq-genetically-modified-food/en/
gmoanswers.com/gmo-basics
Study of GM food opponents in Nature Human Behaviour journal: www.nature.com/articles/s41562-018-0520-3
Article on study on ScienceDaily website: www.sciencedaily.com/releases/2019/01/190114114221.htm

A version of this blog post appeared earlier on www.warrensnotice.com.

30 March 2019

Post-Election School Bullying

Welcome back. Here’s one of those “consequences” of the 2016 presidential election that you might not have expected: increased middle-school bullying and teasing.

Teachers talked about it and there were media reports. Now it’s been documented by researchers from the Universities of Missouri and Virginia.

Virginia School Climate Surveys
The researchers focused on Virginia, using data from school climate surveys completed by some 155,000 seventh- and eighth-grade students in 2013, 2015 and 2017.

Cover photograph of 2017 Virginia Secondary School
Climate Survey Technical Report
(see P.S. for link).
The surveys defined bullying as the repeated use of one’s strength or popularity to purposely injure, threaten or embarrass someone. Fights or arguments between two students who are about the same strength or popularity were not considered bullying. For teasing, the survey excluded friendly teasing that did not hurt someone’s feelings.

The surveys asked students the frequency (“never” to “more than once per week”) that they had been bullied or bullied others, categorizing it as physical, verbal, social and cyber bullying.

Students were asked if they “strongly disagreed” to “strongly agreed” that students in their schools were teased about clothing or physical appearance and teased or put down because of race, ethnicity or sexual orientation. They were also asked if there was a lot of teasing about sexual topics.

Relating Surveys to Election Results
Survey responses were mapped onto 2016 presidential election results for each school district’s locality, controlling for previous bullying and teasing rates, socioeconomic status, population density and percentage of white student enrollment.

The 2013 and 2015 surveys showed no meaningful differences in middle-school student bullying and teasing rates between Democratic and Republican localities.

In contrast, the 2017 survey found bullying rates were 18% higher in localities where voters had favored Donald Trump compared to those that had favored Hillary Clinton. Student reports of peers being teased or put down because of their race or ethnicity were 9% higher in localities that voted Republican.

Viewed by number of voters rather than by bullying rate, a 10% increase in Republican voters corresponded to an 8% increase in bullying and a 5% increase in teasing because of race or ethnicity.

Wrap Up
To be clear, the study results reflect correlation not cause and effect; they do not indicate that support for Trump caused increased bullying. They do, however, offer data points for the concerns voiced by teachers nationwide about bullying following the presidential election.

Most important, the researchers caution that educators, parents and politicians need to be wary of the potential impact of public events, campaign rhetoric and people’s behavior on children. Thanks for stopping by.

P.S.
Study of bullying and teasing after presidential election in Educational Researcher journal: journals.sagepub.com/doi/full/10.3102/0013189X18820291
Article on study on ScienceDaily website: www.sciencedaily.com/releases/2019/01/190109090917.htm
Report of 2017 Virginia Secondary School Climate Survey: curry.virginia.edu/uploads/resourceLibrary/2017_Middle_School_Climate_Survey_Technical_Report_completed_6-26-17.pdf

A version of this blog post appeared earlier on www.warrensnotice.com.

25 March 2019

Waiting for Income

Save your money. (Barney Large Coin
Piggy Bank from www.amazon.co.uk)
Welcome back. Today’s question is Why do some people make more money? If I may get personal, what factors had the greatest effect on your earnings? Go ahead, fill in the blanks.

Researchers from Temple University did. Along with the expected results, such as education and occupation, they found one interesting surprise: Delay discounting ranked high as a predictor of future income.

What’s Delay Discounting?
If you had to choose between receiving $1 today or $2 tomorrow, would you take the $1? Those who take the smaller reward today rather than wait for the larger reward tomorrow are discounting the value of the future reward. Delay discounting refers to how much a person devalues future rewards compared to present rewards.

The classic studies of delayed gratification--the marshmallow experiment--were conducted at Stanford University in the late 1960s and early 1970s. Children were offered one reward (e.g., a marshmallow) immediately or two rewards if they waited about 15 minutes while the person administering the test left the room. Get this: Follow-up studies found children who waited longer tended to have better life outcomes.

Factors Related to Future Income

To improve upon earlier investigations of income attainment, the Temple researchers tested a large, diverse population: 2,564 racially and ethnically heterogeneous, male and female participants, 25 to 65 years in age, pre-high school to PhD in education, $10,000 to $235,000 in annual income and from over 1,700 zip codes.

In addition, they employed a novel analytic approach, using three machine-learning algorithms to model the relationship between income and key factors identified in earlier research--age, gender, ethnicity, height, race, zip code, education, occupation and delay discounting behavior.

Measuring Delay Discounting
Test participants were initially asked to choose between $500 immediately versus $1,000 at five different delays (1 day, 1 week, 1 month, 6 months, 1 year). If they chose the immediate reward, the next question offered an immediate reward midway between the prior immediate reward and zero. If they chose the delayed reward, the next question offered an immediate reward midway between the prior immediate reward and $1,000.

This narrowing pattern continued until participants’ choices converged on the dollar amount subjectively equivalent to the discounted delayed reward if the value were offered immediately. Lower dollar amounts indicated increased devaluation of delayed rewards in favor of immediate rewards.

Study Findings

Modeling with the three machine-learning algorithms, the researchers found that individual differences in income were explained by factors that could be ranked in a consistent manner.

Average ranking of factors according to how well they predicted salary by three machine-learning algorithms (from www.frontiersin.org/articles/10.3389/fpsyg.2018.01545/full).
Occupation and education were paramount with each algorithm, and on average, zip code and gender were the next most important factors. The fifth most important factor was delay discounting, which was more predictive than ethnicity, height age and race.

One study shortcoming is that representation of African Americans and Hispanics in the sample population was only about half that in the U.S. population at large.

Wrap Up
As to why individual differences in discounting of future rewards predicts income attainment, the researchers speculate that it may be a consequence of the correlation between higher discounting and undesirable life choices.

Difficulties delaying gratification may also be affected by episodic future thinking, i.e., the ability to project oneself into the future to pre-experience an event. If people can vividly imagine themselves in the future with the larger rewards, they are more likely to be patient.

So, relax. As you’ve likely heard, all things come to those who wait. Thanks for stopping by.

P.S.
Study of delay discounting for income attainment in Frontiers in Psychology journal: www.frontiersin.org/articles/10.3389/fpsyg.2018.01545/full
Articles on study on ScienceDaily and ScienceAlert websites: www.sciencedaily.com/releases/2018/09/180903101741.htm
www.sciencealert.com/your-ability-delay-instant-gratification-predict-money-earn-delay-discounting-marshmallow-test
Marshmallow experiment: en.wikipedia.org/wiki/Stanford_marshmallow_experiment
Update study of children’s delay of gratification in Developmental Psychology journal: psycnet.apa.org/record/2018-29923-001?doi=1

A version of this blog post appeared earlier on www.warrensnotice.com.

05 March 2019

Science Status Report

Welcome back. Having worked in science and engineering (S&E) for over half a century, I find it difficult to accept that I now have to march to defend science. Nevertheless, I did, as I blogged in Marching for Science

But this blog post isn’t about me or marching; it’s about a report: The National Science Foundation’s Science & Engineering Indicators 2018. The NSF is the federal agency that supports fundamental research and education in non-medical S&E. Its governing National Science Board is congressionally mandated to report the status of U.S. S&E every two years.

Chapters of NSF Science & Engineering Indicators 2018 report.

Although the report is based mainly on data collected through 2015 or 2016, it offers unique and useful background for assessing where we are and where we’re headed.

NSF Report
The online, interactive report is loaded with clearly presented, wide-ranging data and commentary. Included for separate, easy access with the full report are a digest; the data; the figures; trends in S&E by state; sources of U.S. research and development (R&D) expenditures; as well as a further breakdown of other report content.


Cover of NSF Science & Engineering
Indicators 2018
report digest.
The digest is particularly useful, serving in effect as an executive summary that introduces the report, highlights important trends and links to the available data. It focuses on 42 indicators under 7 themes, 3 of which are viewed globally--R&D spending; research outputs; and science, technology, engineering and math (STEM) education--and 4 of which are viewed domestically--R&D funding and performance; the S&E workforce; invention, knowledge transfer and innovation; and public attitudes and understanding of science and technology.

Principal Finding
The big news is that, while the U.S. holds a preeminent global position in S&E, the lead is shrinking. Other nations, especially China, increasingly recognize scientific and technical capabilities as engines of economic growth.

Between 2000 and 2015, China, India and South Korea expanded R&D expenditures rapidly compared to the pace of the U.S and European Union (E.U.). In 2015, the U.S. accounted for 26% of global R&D expenditures; China accounted for 21% of the total.


Percentage of Global R&D expenditures by region in 2000 and 2015 (from NSF Science & Engineering Indicators 2018).
R&D improves production processes in manufacturing and services, a major component of the global economy. China has grown to become the largest global producer in medium-high-technology manufacturing industries and second only to the U.S. in high-technology manufacturing industries.

Research publications contribute to knowledge. In 2016, China produced the largest number of articles in engineering, chemistry, physics, geosciences, computer sciences and agricultural sciences.

Over the past 15 years, nearly half of the S&E bachelor’s degrees awarded globally were conferred in India (25%) and China (22%), compared to 10% in the U.S.

Changes Ahead

Permit me to select data on a few areas that are seeing significant change under the current administration--defense, sustainable energy and immigration.

Defense’s share of the federal R&D budget was anomalously low in 2009 (52%), but since 2010 it has gradually declined (58% to 53%). Expect that to zoom ahead.

The large investment and deployment of sustainable energy technologies grew renewable energy generation capacity from 130 gigawatts (GW) in 2006 to 912 GW in 2016, excluding hydropower. Between 2010 and 2016, China added a cumulative 200 GW of solar and wind generation capacity, the E.U. added a cumulative 137 GW and the U.S. added much less, 82 GW. It’s likely the U.S. will continue to lag.

Foreign-born scientists and engineers are critical to the U.S. S&E workforce--41% of master’s degree holders, 36% of PhDs and over half of PhDs in engineering, computer sciences and mathematics occupations are foreign born. The squeeze on immigration is having an effect. The number of international students in the U.S., which was climbing steadily, dropped in 2017 in nearly all areas. The largest graduate student declines were in computer science and engineering.

Wrap Up

I’ve been living in Wisconsin for the past few years, though my ties are stronger to New York and Virginia. As an example of the state-specific data available in the report and the way it can be manipulated, I compared the percentage of bachelor’s degree holders among individuals 25-44 years old in the U.S. and each state.

Percentage of bachelor’s degree holders among individuals 25-44 years old in U.S., New York, Virginia and Wisconsin, 2005-2016 (derived from data in NSF Science & Engineering Indicators 2018).

I strongly recommend you take a look at the report. I’m sure you’ll come up with something much more significant. Thanks for stopping by.

P.S.
NSF’s Science & Engineering Indicators 2018 report: www.nsf.gov/statistics/2018/nsb20181/
Article on report on ScienceDaily website: www.sciencedaily.com/releases/2018/01/180124113951.htm

A version of this blog post appeared earlier on www.warrensnotice.com.