Showing posts with label Discrimination. Show all posts

05 August 2022

Black Females’ Natural Hair

Welcome back. Two years ago I added a research publication to my list of possible blog posts as I regularly do. Like most papers on the list, I never got to it, though I was happy to find I hadn’t deleted it. A related study was recently published, and I can now review both studies to offer a wider perspective.

The topic, as you’ll see from the title, is Black/African American females' natural hair. The earlier study demonstrated job recruitment bias against women with natural hairstyles; the recent study examines the negative experiences of young girls related to their hair. 

Example natural hairstyles (by Melanated Rose from www.pinterest.com/pin/377246906283514170/).
Job Recruitment Bias
Researchers affiliated with Michigan State and Duke universities conducted four tests involving hundreds of participants of different races. They asked the participants to screen potential job candidates based on mocked-up Facebook and LinkedIn profiles.

In one test, participants evaluated profiles of Black and White female applicants across a variety of hairstyles. Black women with natural hairstyles were perceived to be less professional, less competent and less likely to be recommended for a job interview than either Black women with straightened hairstyles or White women with curly or straight hairstyles.

In another test, two groups of participants were asked to evaluate the same Black female candidate. One group saw a photo of the candidate with natural hair, the other saw an image of her with straightened hair. The latter group gave the candidate a higher score for professionalism and more strongly recommended her for interview.

Results also varied by industry. For example, Black female candidates with natural hair were discriminated against for positions in management consulting, which has conservative dress norms, but not for positions in advertising, a more creative industry with less rigid dress norms.

Addressing Hairstyle
The lead researcher pointed out that a Black woman with a natural hairstyle should not be seen as making a statement. The style might just be the easiest, healthiest or most cost-effective, given the cost of straightening treatments and their potential negative effects on hair and scalp.

It should also be noted that, in recent years, the US military services have adopted hairstyle policies to be more inclusive and that several states, following California’s CROWN (Create a Respectful and Open Workplace for Natural Hair) Act, have passed legislation banning discrimination against natural hairstyles.

Assessing Black Girl’s Natural Hair Experience
After obtaining input and approval from parents, consultants and the university, researchers with Arizona State University, Mayo Clinic and the Unilever House conducted an online study with 105 Black/African American girls, 10 to 15 years old.

The study encompassed self-reported measures and 16 focus groups of 3 to 12 girls to assess satisfaction with natural hair, extent of bullying and teasing due to hair, the degree to which they engage in social comparisons, and friends and family’s perspectives on their hair.

The Negative Experiences
A majority (81%) reported experiencing or witnessing hair-related bullying or teasing by peers and educators predominantly in school settings--approximately 22% of 10-year olds, 14% of 11-year olds, 54% of 12-year olds, 35% of 13-year olds and 32% of 14-year olds.

Bullying and teasing consisted of negative comments or hair touching without permission. The higher the frequency, the lower the hair satisfaction and general self-esteem.

All focus groups showed an awareness of negative stereotypes associated with natural hair, lack of representation of natural hair in the media and the pressure to conform to Eurocentric hair ideals, where good hair is depicted as long, straight and smooth even in media images of Black women.

Engaging in hair comparison with models/celebrities and peers was significantly associated with less hair satisfaction. But having friends who like one’s natural hair was significantly associated with higher hair satisfaction scores.

Focus group questions and themes of girls’ responses from a total of 16 groups of 3 to 12 girls (from journals.sagepub.com/doi/abs/10.1177/1948550620937937).
Wrap Up
From what I see in the media, from military policy changes and from states passing legislation to ban discrimination, I’d like to think things are improving. A federal law prohibiting racialized hair discrimination has moved ahead in the House but stalled in the Senate.

As for young girls, it’s of interest, albeit sad, that the study corroborates the recall of Black/African American adults’ experiences with hair discrimination. The researchers suggest that schools consider banning hair discrimination.

Thanks for stopping by.

P.S.
Study on job recruitment bias in Social Psychological and Personality Science journal: journals.sagepub.com/doi/abs/10.1177/1948550620937937
Articles on study on EurekAlert! website and CNN:
www.eurekalert.org/pub_releases/2020-08/du-rsb081020.php
www.cnn.com/2020/08/12/business/black-women-hairstyles-interview-scli-intl-scn/index.html
Wikipedia articles on discrimination based on hair and California’s CROWN Act: en.wikipedia.org/wiki/Discrimination_based_on_hair_texture_in_the_United_States
en.wikipedia.org/wiki/CROWN_Act_(California)

08 July 2022

U.S. Anti-Asian Tweets

Welcome back. Forgive my gloom, but it’s getting hard to keep up with the hate in America.

Citing a report on 2021 hate crime data by the Center for the Study of Hate and Extremism, an NBC News article identified Black Americans as the most targeted group in most cities, Jews in New York, gay men in Chicago, and the most hate crimes of any U.S. city this century in Los Angeles.

The focus of that NBC News article was anti-Asian hate crimes, which jumped 339% in 2021 compared to 2020, when New York, San Francisco, Los Angeles and other cities had record numbers.

Members of K-pop band BTS visit White House to film an anti-Asian hate video with President Biden and address the topic with the press, 31 May 2022 (The White House/Adam Schultz photo from www.teenvogue.com/story/bts-white-house-visit-2022).
Analyzing Anti-Asian Hate in the U.S.
The anti-Asian hate incidents arising from the messaging that blamed COVID-19 on China led a team of researchers affiliated with Utah and Arizona State universities to examine anti-Asian hate in the U.S.

Approaching the study as a first step toward understanding whether racist trends on social media give rise to harm in the real world, their analyses relied on tweets.

The researchers purchased 4,234,694 geolocated tweets from Twitter, then searched the dataset for tweets that were located in the contiguous U.S.; written in English; sent in the early stage of the COVID-19 outbreak, November 2019 to May 2020; and had keywords reflecting COVID-19.

They classified the resulting 3,274,614 tweets into hateful or non-hateful based on the presence of additional keywords related to anti-Asian hate (e.g., kungflu).

Temporal Analysis of Hateful Tweets
From November 2019 to May 2020 the number of daily hateful tweets was very low until January 2020, when they began to surge, culminating in the first of two spikes.

The first spike occurred when COVID-19 was initially reported in the U.S. The second spike occurred in mid-March, when former President Trump began tweeting about the “Wuhan flu” and “Chinese virus.”

Anti-Asian COVID-related tweets, Nov. 2019-May 2020; red line is total number of daily tweets in study’s dataset; blue line is percentage of tweets that express hateful sentiment (graphic by Alexander Hohl from ajph.aphapublications.org/doi/full/10.2105/AJPH.2021.306653).
In time, the number of anti-Asian tweets fell, yet it remained higher than before the pandemic.

Spatial Analysis of Hateful Tweets
The researchers plotted the anti-Asian hateful tweet locations on a U.S. map. Although the tweets were scattered across the U.S., there were 15 geographic clusters where the number of tweets were statistically higher than expected based on the underlying population. (The strongest cluster was in Ross County, Ohio, where the proportion of hateful tweets was about 300 times higher than the rest of the country.)

Along with mapping the hateful tweets and clusters, the researchers also calculated what they labeled the relative risk for every U.S. county. This statistic was the ratio of the number of hateful tweets sent inside a county to the number of hateful tweets sent outside the county.

 Spatiotemporal distribution of continental U.S. hateful tweets against Asians and Asian Americans, highlighting 15 clusters and counties’ “relative risk,” defined as ratio of hateful tweets sent inside a county versus outside (from attheu.utah.edu/facultystaff/anti-asian-hate-tweets-during-covid-19/).
Wrap Up
The researchers plan to continue their analyses, seeking to identify demographic and socioeconomic factors that explain cluster locations and to determine if the mapping can predict where racists attacks are most likely to occur.

The maps might thus contribute to informing decision-makers in public health and safety when allocating resources for place-based preparedness and response to pandemic-induced racism. That would be a good thing.

Thanks for stopping by.

P.S.
NBC News article on anti-Asian hate crimes: www.nbcnews.com/news/asian-america/anti-asian-hate-crimes-increased-339-percent-nationwide-last-year-repo-rcna14282
Center for the Study of Hate and Extremism, California State University, San Bernardino: www.csusb.edu/hate-and-extremism-center
Study of anti-Asian tweets in American Journal of Public Health: ajph.aphapublications.org/doi/full/10.2105/AJPH.2021.306653
Articles on study on EurekAlert! website and University of Utah Communications:
www.eurekalert.org/news-releases/954418
attheu.utah.edu/facultystaff/anti-asian-hate-tweets-during-covid-19/


24 June 2022

Workplace Religious Discrimination

Welcome back. I don’t often blog about religion, though in recent years I have reviewed studies on Religion and Science, Religion and Millennials and Accepting Evolution. And now I’ll add one more.

During my hiatus, researchers affiliated with Rice University, the University of Texas and Wheaton College published a study on how religious discrimination is perceived in the workplace. I flagged the paper when it appeared and finally caught up with it. I found it interesting and thought you might too.

Study Background

Discrimination in the workplace has been studied in depth, but not religious discrimination. Charges of religion-based discrimination in the workplace filed with the Equal Employment Opportunity Commission from fiscal year 1992 (the first year the EEOC began reporting these data) to FY 2020 increased by 73%. Over the same period, charges due to other sources of discrimination generally decreased (sex, -1.8%, race, -25%, national origin, -14%).

Religion-based workplace complaints filed with the Equal Employment Opportunity Commission, FY 1997 to FY 2010. Although a small proportion of overall charges (3.6% percent as of FY 2020), their growth illustrates the need to study religious discrimination more fully (graphic from The Plain Dealer, www.cleveland.com/business/2011/11/religion_and_the_workplace_don.html).

Behaviors creating a hostile work environment on the basis of an employee’s religious identity are considered harassment and are illegal. Nevertheless, more subtle behaviors--religious microaggressions--not reflected in official legal frameworks may still be perceived by employees as negative or unfair.

To highlight the ways employees perceive workplace religious discrimination and othering (being treated as others, not fitting in with the group), the researchers conducted a national survey of 11,356 members of a Gallup Panel. They followed that with 194 interviews with 159 Christians, 10 Muslims, 13 Jews and 12 nonreligious survey respondents. 

The study focused on Christian, Jewish, Muslim and nonreligious people in the workplace. (graphic from www.ajc.org/issues/interreligious-relations).
Perceived Religious Discrimination is Common
In the national survey, 27% of respondents perceived religious discrimination during their working tenure, with larger proportions of Muslim (63%) and Jewish (52%) respondents and 27% of nonreligious respondents. Of Christian subgroups, 36% of evangelical Protestants, 24% of other Christian/other Protestants and roughly 20% of Catholics and mainline Protestants reported religious discrimination.

In interviews, all respondents described similar perceived unfair or differential treatment (e.g., name-calling and stereotyping, social exclusion and othering, negative experiences tied to religious holidays or display of religious symbols); however, their accounts revealed nuances in individual experiences as well as differences between majority and minority groups’ experiences.

Verbal Microaggressions and Stereotyping
The most common form of religious discrimination was verbal microaggressions, such as name-calling, mocking, ridicule and uncomfortable joking, which could be accompanied by other forms of harassment or a sense of being judged or stereotyped.

Jewish and Muslim respondents described microaggressions tied to anti-Semitic and anti-Islamic stereotypes, which reinforced ideologies used to justify violence against Jews and Muslims. Verbal microaggressions were accompanied by racial/ethnic or national origin discrimination, underscoring how religious discrimination targeting minority groups is often entangled with racism, nativism and white nationalism.

Evangelical Christians described being stereotyped as narrow-minded, judgmental or thinking they were better than others. They often linked these instances to taking a moral stand or religious visibility and being censured for having integrity. Such narratives might also serve to reinforce a sense of evangelical distinctiveness.

Social Exclusion and Othering
Several Jewish and Muslim respondents felt coworkers treated them as exotic, foreign or fragile because of their religion.

Evangelical Christians described how coworkers stopped conversations when they approached, excluded them in the workplace and never invited them to after-work events. For some, the sense of hostility or feeling unwelcome was enough to leave their jobs or apply for specific jobs.

Fearing social exclusion or censure, nonreligious people described feeling compelled to downplay or hide their nonreligion.

Religious Holidays and Symbols
Jewish and Muslim respondents described struggles around issues of religious attire. Some concealed or downplayed their religious identity to forestall mistreatment and hostility.

Several Christians described hostility from superiors when they observed religious holidays or displayed religious symbols.

Nonreligious people shared how coworkers’ religious expression around holidays made them uncomfortable and how accommodations for religious people could cause a sense of unfair treatment toward the nonreligious.

Comment on wishing “Happy Holidays” (from www.religioustolerance.org/xmas_conflict1.htm).
Wrap Up
I was disappointed how little seems to have changed over the past 50 plus years. I was also concerned about reading too much into such small samples.

But as the researchers note, studying groups alongside one another provides the fullest picture of workplace religious discrimination and points the way toward further research of how both majority and minority groups perceive discrimination.

Thanks for stopping by.

P.S.
U.S. Equal Employment Opportunity Commission (EEOC) rules on religion-based discrimination: www.eeoc.gov/religious-discrimination
Study of religious discrimination in the workplace in Socius: Sociological Research for a Dynamic World: journals.sagepub.com/doi/full/10.1177/23780231211070920
Article on study on EurekAlert! website: www.eurekalert.org/news-releases/946187


07 May 2021

Voting Access

Welcome back. The initial results of the 2020 Census were released last month, and the race has begun. Population counts from the census are used to apportion the 435 seats in the House of Representatives among states and, thus, also determine the number of each state's electoral votes (one per senator and one per House seat) for the next 10 years.

2020 Census results (from news.yahoo.com/census-results-big-disappointment-hispanic-005034556.html).
By the end of September, the Census Bureau will provide the breakdown of population by local areas. Each state will then redraw (redistrict) their congressional districts to ensure they are of equal population and adjust other legislative boundaries.

Although some states with more than one district have shifted redistricting from the state legislatures to special commissions or made other changes, most have not (33 at last count). Instead, these states use or have the potential to use redistricting for partisan gerrymandering (manipulate district boundaries to favor their party). Gerrymandering can exert a huge influence on election results and everything that goes with that.

Wait, this isn’t a blog post about gerrymandering; in most cases, we’ve got 10 years to fix that. There’s an immediate, more pressing problem. Partisan politicians won’t need gerrymandering if they can stop people from voting.

Suppressing the Vote

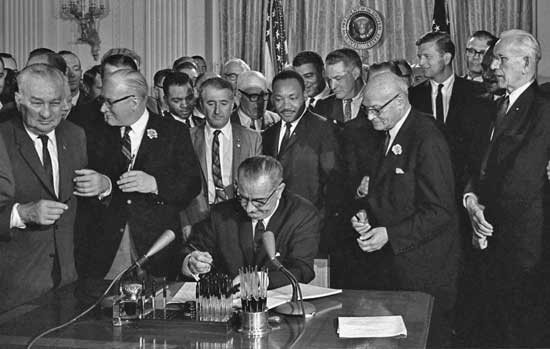
The Voting Rights Act of 1965 required certain states and local governments that had a history of voting discrimination to obtain federal approval before implementing any change to their voting laws or practices. That protection went by the wayside in 2013, when the Supreme Court ruled, in Shelby County v. Holder, that one section of the Voting Rights Act was no longer constitutional.

President Lydon Johnson signing the Voting Rights Act of 1965 into law, with Dr. Martin Luther King, Jr., other civil right activists and politicians standing behind him (from dp.la/primary-source-sets/voting-rights-act-of-1965/sources/1389).
Did it matter? Oh, did it ever. Within five years after the ruling, there were cuts to early voting, purges of voter rolls, imposition of strict voter ID laws and closure of nearly 1,000 polling places, many in predominantly African-American counties. Virtually all voting restrictions were by Republicans.

But apparently that wasn’t enough. Trump’s unsubstantiated claims of election fraud convinced millions of his supporters that the results were rigged, undermined voter trust and gave Republican state legislators a new, albeit bogus, justification to restrict voting access--election integrity. As of late March, they had introduced 361 bills in 47 states.

An April Pew Research Center survey of 5,109 U.S. adults confirmed that Republicans and Republican-leaning independents bought into what Trump has been pitching and now back what their legislators have been trying to do for years. For example, the percentage that favor early or absentee voting without a documented reason fell from 57% in 2018 to 38%, while Democrat and Democrat-leaning independents’ support remained over 80%.

Wrap Up
That April Pew survey found marked differences in Democrat and Republican support for multiple voting proposals, from requiring government-issued photo IDs to allowing ex-felons to vote. 

Pew Research Center survey of response of Democrats/Democrat-leaning independents and Republicans/Republican-leaning independents to voting access proposals; April 5-11, 2021, 5,109 U.S. adults (from www.pewresearch.org/politics/2021/04/22/republicans-and-democrats-move-further-apart-in-views-of-voting-access/).
Still, the current political split is best captured with the finding of a March Pew Center survey of 12,055 U.S. adults: Everything possible should be done to make it easy for every citizen to vote – agreed to by 28% of Republicans/Leaning Republican and 85% of Democrats/Leaning Democrat.

Thanks for stopping by.

P.S.
Census:
www.census.gov/library/visualizations/interactive/historical-apportionment-data-map.html
www.census.gov/library/stories/2021/04/2020-census-data-release.html
Redistricting and gerrymandering:
www.ncsl.org/research/redistricting/redistricting-systems-a-50-state-overview.aspx
apnews.com/article/15945f8bd618d3c749e7c56d3a572d71
ballotpedia.org/State-by-state_redistricting_procedures
www.nytimes.com/2019/06/27/us/what-is-gerrymandering.html
www.americanprogress.org/issues/democracy/reports/2020/07/08/487426/partisan-gerrymandering-limits-voting-rights/
Voting Rights Act of 1965 and Shelby County v. Holder:
en.wikipedia.org/wiki/Voting_Rights_Act_of_1965#Coverage_formula
en.wikipedia.org/wiki/Shelby_County_v._Holder
Voter suppression and latest threats:
www.brennancenter.org/our-work/research-reports/voting-laws-roundup-march-2021
www.washingtonpost.com/politics/interactive/2021/voting-restrictions-republicans-states/
www.cnn.com/2021/04/03/politics/state-legislation-voter-suppression/index.html
en.wikipedia.org/wiki/Voter_suppression_in_the_United_States
us.newschant.com/politics/with-florida-bill-republicans-continue-unrelenting-push-to-restrict-voting/
www.nytimes.com/2021/05/01/us/politics/republican-pollwatchers.html
Pew Research Center surveys:
April 2021: www.pewresearch.org/politics/2021/04/22/republicans-and-democrats-move-further-apart-in-views-of-voting-access/
March 2021: www.pewresearch.org/fact-tank/2021/04/01/share-of-republicans-saying-everything-possible-should-be-done-to-make-voting-easy-declines-sharply/

13 November 2020

Fatal Police Shootings

Welcome back. Living in the D.C. area for more than 20 years, I was a regular reader of The Washington Post. I still see selected articles, but most of the content goes by. I wasn’t aware, for example, that the newspaper started logging every fatal shooting in the U.S. by an on-duty police officer.

The Post began that project after its investigation of the 2014 shooting of Michael Brown, Jr., in Ferguson, Mo., found the FBI undercounted fatal police shootings by more than half. Reporting by police departments is voluntary and many don’t.

The Post’s “Fatal Force” database begins on 1 January 2015; relies primarily on news accounts, social media postings and police reports; is updated as new information is obtained; and is searchable by state, gender, race, age, mental illness, weapon, body camera, fleeing the scene, year, as well as name.

The Washington Post’s database of fatal shootings by on-duty police officers (from www.washingtonpost.com/graphics/investigations/police-shootings-database/).
Although The Washington Post makes the database available publicly, a team of medical researchers affiliated with Penn, Yale and Drexel universities judged it was critical that fatal police shootings of Black, Indigenous and People of Color (BIPOC) be recognized and treated as a public health emergency. Toward that end, they decided to enter the data into the scientific literature and present it using methods that are accepted by science as rigorous and robust.

Relative Rates of Fatal Police Shootings
For their recently published study, the researchers conducted a longitudinal analysis of 4,653 of the 5,367 fatal police shootings listed through May 2020, omitting those lacking race/ethnicity or age details.

Using generalized linear-mixed models to capture trends with time and rates relative to respective populations, they found shootings of BIPOC, whether armed or unarmed, were essentially constant from 2015 to 2020 and significantly higher than that of Whites. 

Fatal U.S. police shootings by ethnicity, 1 Jan 2015–14 July 2020; graphic’s end date is several weeks after that of study (The Washington Post data; www.statista.com/chart/21857/people-killed-in-police-shootings-in-the-us/).
For armed victims, the rates that Native Americans, Blacks and Hispanics were killed were, respectively, 3 times, 2.6 times and 1.3 times higher than the rate Whites were killed. For unarmed victims, the rates that Blacks and Hispanics were killed were, respectively, 3 times and 1.4 times the rate of Whites. The average age of Whites killed was 38; Native Americans, Blacks and Hispanics were younger, 31, 30 and 33, respectively.

Years of Life Lost
The researchers also calculated the estimated years of life lost by race/ethnic group. Basing the estimates on national historical life expectancy data for U.S. citizens in the victim's birth year vs. age at death, they found an average 31,960 years of life lost annually due to police shootings. Relative to Whites, the years of life lost were 4 times higher for Native Americans, 3.3 and 3.5 times higher for Blacks overall and unarmed, and 1.6 times higher for Hispanics overall and unarmed.

Another, more difficult factor to quantify is that Blacks report worse mental health in areas where there are police killings.

A center-of-the-road memorial to Michael Brown, Jr., for the 5th anniversary of his fatal shooting by a police officer, 9 Aug 2014; the neighborhood memorial was in place on 8 Aug and will be guarded overnight by the man in the folding chair (photo by Robert Cohen for St. Louis Dispatch, rcohen@post-dispatch.com).
Wrap Up
Why should the number of fatal police shootings be almost the same, nearly 1,000, every year since the Post started its tally? The database website points to probability theory for a possible explanation. In essence, the quantity of rare events in huge populations tends to remain stable absent major societal changes. For police shootings, that change could involve a fundamental shift in police culture or restrictions on gun ownership.

Treating the shootings as a public health emergency, the researchers note that what has been done at the local level--body cameras and independent investigations--is insufficient. It must be raised to the state and national level and codified into law.

So, should it be more Law and Order, more Black Lives Matter or…well, what do you suggest? Thanks for stopping by.

P.S.
The Washington Post “Fatal Force” website: www.washingtonpost.com/graphics/investigations/police-shootings-database/
Study of fatal police shootings in Jour. of Epidemiology & Community Health: jech.bmj.com/content/early/2020/10/20/jech-2020-215097
Articles on study on EurekAlert! and Yale University websites:
www.eurekalert.org/pub_releases/2020-10/b-fps102320.php
news.yale.edu/2020/10/27/racial-disparity-police-shootings-unchanged-over-5-years
CDC’s definitions of years of potential life lost: www.cdc.gov/injury/wisqars/fatal_help/definitions_ypll.html

21 August 2020

U.S. Slave Descendant Genetics

Welcome back. Black Lives Matter has stirred the call for reparations. Although the case for reparations for slavery is easily justified economically, socially and morally, the U.S. has failed to take any action. And a 2019 Gallup poll found Americans were opposed to cash payments to Black Americans who were descendants of slaves.

Americans’ views on cash reparations for slavery (from
news.gallup.com/poll/261722/redress-slavery-americans-oppose-cash-reparations.aspx)
.

It’s difficult to consider offering cash to so many Americans for something that happened centuries ago. Maybe the focus should be on reparations for wrongs done under the “Jim Crow” laws that legalized racial segregation from the post-Civil War era until 1968. These laws marginalized African Americans, denying the right to vote, hold jobs, get an education or other opportunities. The effects of redlining neighborhoods for denial of services and discriminatory housing practices, banned years ago, are still felt today.

But this is a post about slavery, not reparations. I thought you would be interested in a study that added genetic data to the historical records of the transatlantic slave trade--the forced displacement of more than 12.5 million men, women and children from Africa to the Americas between 1515 and 1865. 

Canoe used in West Africa to transport slaves from the coast to the transatlantic vessel; canoes could carry 200 slaves in their bottom, 1849 (from slavevoyages.org/resources/images/category/Vessels/2).
Adding Genetics
23andMe, Inc., the consumer personal genetics company, coupled genetic data of more than 50,000 people with transatlantic records from the Slave Voyages database, which catalogs dates, disembarkation-embarkation ports, along with a wealth of information about each voyage.

The slave decks and instruments used to chain the slaves on the Vigilante, a French slave ship that carried 345 slaves, 1822 (from slavevoyages.org/resources/images/category/Vessels/1).
The researchers found the genetic evidence was generally consistent with historical records. Most enslaved people arriving in Latin America were deported from one or two slave-trading regions; those arriving in the U.S. and British Caribbean were from all regions of Atlantic Africa.

There were inconsistencies, and these were addressed with additional historical accounts. For example, overrepresentation of Nigerian ancestry in parts of the Americas is explained by the intra-American slave trade from the British Caribbean. Underrepresentation of Senegal and Gambia ancestry across the Americas is supported by accounts of high mortality of children in transit and of Senegambians taken to rice plantations, often rife with malaria.

African Female Sex Bias
Inconsistencies of lower African ancestry and higher African female sex bias were attributed to socioeconomic factors, non-African male admixture and inhumane treatment.

More than 60% of enslaved people brought to each region were male, yet ancestry estimates revealed a bias toward African female. The study found between 4 and 17 African females for every African male contributing to the gene pool in Latin America and 1.5 to 2 African females for every African male contributing to the gene pool in British-colonized Americas.

The Americas-wide sex-bias can be attributed to generations of rape of enslaved African women by slave owners and other sexual exploitation. Regional differences may be due to higher mortality of enslaved men in Latin America as well as to racial whitening, marrying women with lighter-skinned men to produce lighter-skinned children. The lower African female sex-bias in former British colonies may be due to the practice of coercing enslaved people to have children to maintain the workforce, especially near the abolition of the transatlantic slave trade. Segregation could be a factor in the U.S.

Wrap Up
The researchers conclude, While transatlantic records have told us a large part of the story, insights from this study in combination with other historical accounts shed light on details of the genetic impact of the transatlantic slave trade on present-day populations in the Americas.

They hope the study will help the millions of people whose ancestors were forced from Africa to the Americas to better understand where their ancestors came from and what they had to endure.

Thanks for stopping by.

P.S.
Example articles on reparations:
www.brookings.edu/policy2020/bigideas/why-we-need-reparations-for-black-americans/
www.usatoday.com/story/news/world/2020/07/10/slavery-reparations-bill-spurs-new-debate-other-nations-model/5396340002/
en.wikipedia.org/wiki/Reparations_for_slavery
Gallup Poll on cash reparations for slavery: news.gallup.com/poll/261722/redress-slavery-americans-oppose-cash-reparations.aspx
Jim Crow Laws: www.history.com/topics/early-20th-century-us/jim-crow-laws
Reparations focused on Jim Crow Laws, including redlining:
www.psychologytoday.com/us/blog/crimes-violence/201406/reparations-african-american-survivors-jim-crow
www.aaihs.org/housing-discrimination-in-the-jim-crow-us/
www.wbur.org/cognoscenti/2019/06/27/the-case-for-reparations-julie-wittes-schlack
www.washingtonpost.com/news/wonk/wp/2018/03/28/redlining-was-banned-50-years-ago-its-still-hurting-minorities-today/
www.brookings.edu/research/americas-formerly-redlines-areas-changed-so-must-solutions/

Genetics study of slave trade in American Journal of Human Genetics: www.cell.com/ajhg/fulltext/S0002-9297(20)30200-7
Articles on study on EurekAlert! and CNN websites:
eurekalert.org/pub_releases/2020-07/cp-rth071620.php
www.cnn.com/2020/07/26/us/dna-transatlantic-slave-trade-study-scn-trnd/index.html
Slave Voyages website: slavevoyages.org/

31 May 2019

Response to Diversity

Welcome back. Blogging about my most memorable birthday cake years ago, I devoted most of the post to describing the people in the small Upstate New York city where I grew up in the 1940s and ‘50s (Accented Birthday Cake).

Many were first generation Americans, but unlike large cities, there were no concentrations from any one country or conversant in any one language. Being dispersed and immersed, they had to learn some words of English if they were to communicate beyond the family.


Warren’s maternal
grandparents, 1946.
A Proverbial Melting Pot
I wrote about my grandmother from Eastern Europe or possibly the Russian Empire, who could get by in a handful of languages, including heavily accented English. (My grandparents spoke English to me, but not to each other.)

Dominic, who owned the food market near my father’s store, would prepare a sandwich for me, speaking Italian to himself or a helper and a mix of English and Italian to me. (No, I’m not Italian nor do I speak it.)

A school classmate’s family owned a diner, where they spoke English with patrons, Greek to each other and both languages with their children.

Our French-Canadian neighbors would switch fluently between French and English.

We never thought twice if someone didn’t speak English in public, yet a recent survey found that now seems to bother some people.

Americans’ Views of Diversity
The online survey was conducted to gauge Americans’ view about the impact of diversity and the best way to achieve it. Data were provided by 6,637 U.S. adults from the Pew Research Center’s American Trends Panel in early 2019. Here is a sample, only a sample, of the results.

Hearing a Foreign Language
Overall, about 29% were bothered some or a lot to hear people speaking anything other than English in public. Those bothered most were over 65 years old (I’m stunned), less educated and Republican or Republican leaning.

Pew Research Center Survey (see P.S.)
Diversity’s Value and Impact
A clear majority (76%) said that racial and ethnic diversity is at least somewhat good for the U.S. The less educated and Republicans or Republican-leaning responders weren’t quite as convinced, but well over half were.

Pew Research Center Survey (see P.S.)
Expanding on diversity, the majority (64%) said that having many different races and ethnicities has a positive impact on the country’s culture. That view was most strongly held by Democrats and Democrat-leaning responders, yet half of Republicans and Republican-leaning responders agreed.

Workplace Diversity
Three-fourths of the survey responders said it was somewhat or very important for employers to promote workplace diversity; however, a like number of responders said that race and ethnicity should not be a factor in hiring or promotions.

Pew Research Center Survey (see P.S.)
School Diversity
The survey asked the relative importance of having students attend local versus racially and ethnically mixed schools. Overall, most (54%) favored local schools, regardless of the schools’ level of diversity. The percentages differed significantly between white and black responders, with nearly double the number of blacks favoring racially and ethnically mixed schools.

Pew Research Center Survey (see P.S.)
Wrap Up
The survey found that, whether white, black, Hispanic or Asian, most Americans have some interactions daily with people of other races or ethnicities. That’s a start.

And, again, most Americans favor diversity and recognize its value to our culture. I’m afraid those who don’t, those who are bothered to hear foreign languages spoken in public, may just have to get used to it. The Census Bureau projects that blacks, Hispanics, Asians and other racial minorities will make up the majority of the U.S. population by 2050.

Thanks for stopping by.

P.S.
Pew Research Center Survey: www.pewsocialtrends.org/2019/05/08/americans-see-advantages-and-challenges-in-countrys-growing-racial-and-ethnic-diversity/

All tables are from the cited Pew Research Center survey. The following applies to all: Whites, blacks and Asians are those who report being one race and non-Hispanic. Hispanics are of any race. Asians were interviewed in English only. Though included in the totals, they may not be shown separately due to small sample size.

17 March 2019

Generations Apart

Multiple generations: Warren
(center) with aunts, uncle,
cousin and grandmother.
Welcome back. I’m always interested in how people of different generations--never mind different political persuasions--vary in their feelings about current issues.

I’m now filed under Silent Generation, yet I often find myself more aligned with Millennials. Maybe it’s from years of teaching, advising or just interacting with a variety of bright U.S. and international students, today’s Baby Boomers, though it’s probably more a matter of how I was raised and that I was an undergrad and grad student through the 1960s.

Pew Survey of Generation Gap
Alas, despite my rambling, this post isn’t about me. The Pew Research Center released a report that examines the attitudes and political values of four U.S. generations: Millennials, born 1981 to 1996; Generation X, 1965 to 1980; Baby Boomers, 1946 to 1964; and Silents, 1928 to 1945. The findings are based on Pew surveys conducted in 2017 and 2018, with chronological trends incorporating Pew’s older survey data.

Opinion-wise, Millennials and Gen Xers regularly diverge from Boomers and Silents; on many issues, Millennials and Silents stand alone as opposites. As you might expect, the younger generations, particularly Millennials, express more liberal views on many issues and have stronger Democratic (vs. Republican) leanings. Diversity must be a major influence. Millennials are more than 40% nonwhite, Silents are 21% nonwhite.

I thought, like me, you might be interested in the generational responses to some topics. Perhaps, also like me, you’ll want to switch generations.

Immigrants and Openness
Opinions about immigrants have become more positive in recent years, albeit divided politically and by generation. A 2017 survey found 79% of Millennials, 66% of Gen Xers, 56% of Boomers and 47% of Silents thought immigrants strengthen our country because of their hard work and talents. Notably, the survey question did not distinguish legal from illegal immigrants.

Slightly higher percentages of each generation said that America’s openness is essential to who we are as a nation. When parsed by political party, however, the responses of each generation’s Democrats and those leaning Democrat (I’ll combine as “Democrats”) were about 30% higher than the corresponding responses of Republicans and those leaning Republican (“Republicans”). The Millennial Republicans were the only generation of Republicans with over half favoring openness.

America’s openness to people. (from
www.people-press.org/2018/03/01/the-generation-gap-in-american-politics/)
Border Wall and Dreamers
A 2018 survey registered opposition to expanding the border wall with Mexico, though generations differed significantly. Among whites, only Millennials were strongly opposed. White Boomers and Silents favored the wall, and Gen Xers were near evenly divided.

Border wall with Mexico. (from
www.people-press.org/2018/03/01/the-generation-gap-in-american-politics/)
In contrast to differing opinions regarding a border wall, there was broad support, especially from Millennials, for granting permanent legal status to immigrants who came illegally to the U.S. when they were children.

U.S. Uniqueness
Silents, at 46%, led other generations in thinking the U.S. stands above other countries, though 55% to 60% of Boomers, Gen Xers and Millennials describe the U.S. as one of the greatest countries.

America’s uniqueness. (from
www.people-press.org/2018/03/01/the-generation-gap-in-american-politics/)
Trust in Government and Economic Inequality
Years of partisanship and political gridlock have had their effect. The generations’ lack of trust in the federal government is sad. Only 18% of those surveyed say they can trust the government to do what is right most of the time or about always, and the difference among generations is 4% or less.

Economic inequality went from bad to worse after the Great Recession. Large majorities of all four generations--75% of Silents and nearly 85% of the other three generations--say economic inequality in the U.S. is a very big or moderately big problem.

President Trump’s Performance
Surveys through 2017 into 2018 found 37% approve and 57% disapprove of the way Donald Trump handled the first year of his presidency. Those approving his performance included 46% of Silents, 44% of Boomers, 36% of Gen Xers and 27% of Millennials.

President Trump’s first-year performance. (from
www.people-press.org/2018/03/01/the-generation-gap-in-american-politics/)
Wrap Up
Well, were you surprised by your generation’s responses? I’ll stop with this sample and encourage you to review the Pew Research Center report. Among other issues surveyed are diplomacy vs. military strength, taking allies’ interests into account, government and health care, global warming, Islam and violence, racial discrimination, same-sex marriage and legality of abortion.

Thanks for stopping by.

P.S.
Pew Research Center report on generation gap: www.people-press.org/2018/03/01/the-generation-gap-in-american-politics/

A version of this blog post appeared earlier on www.warrensnotice.com.

20 November 2018

Hiring Discrimination

Welcome back. Forgive me, but I hope today’s blog post depresses you. How did we ever elect Barack Obama when racial discrimination is so persistent?

Research collaborators from Northwestern and Harvard universities, the Paris Institute of Political Studies and the Norwegian Institute for Social Research recently published a report on their study of hiring discrimination against African Americans and Latinos.
Title VII of the Civil Rights Act of 1964 is a
federal law that forbids discrimination in any
aspect of employment, including hiring.
Meta-Analysis of Field Experiments
The investigators’ study involved a meta-analysis of every available field experiment that tested hiring discrimination against African Americans or Latinos from 1989 through 2015. (A meta-analysis, you’ll recall, combines data from multiple studies to develop a single conclusion with greater statistical power.)

The field experiments included both resume audits and in-person audits. For resume audits, indicators of race, such as racially identifiable names, are randomly assigned to otherwise similar resumes submitted online or by mail to employers. For in-person audits, racially dissimilar but otherwise matched pairs of trained testers apply for jobs. Resume and in-person audit methods both provide a strong basis from which to draw conclusions about hiring discrimination.

The researchers initially identified 34 US-based field experiment studies of hiring that contrasted white and nonwhite applicant profiles in near equivalent labor-markets (e.g., education, experience level). Of those, screening yielded 24 studies containing 30 estimates of discrimination against African Americans and Latinos from 1989 to 2015. Together these 24 studies represented 54,318 applications for 25,517 positions.

Callback Discrimination
Hiring discrimination was measured by callbacks—invitations to the applicants to interview. A discrimination ratio for each study was computed as the ratio of the percentage of callbacks received by white applicants to the percentage of callbacks received by African Americans or Latinos. A meta-analysis was then applied to aggregate the ratios over the years and estimate the trend in discrimination.

On average, white applicants received 36% more callbacks than equally qualified African Americans. The trend analysis showed no evidence of change over time in the rates of hiring discrimination of African Americans.

Compared to Latinos, white applicants received 24% more callbacks on average. Although the trend over time showed some evidence of a decline in discrimination, the small number of Latino field experiments (only 9) had a high level of statistical uncertainty.

Wrap Up
The researchers allow that hiring discrimination may have dropped substantially in the 1960s or early 1970s, at the height of the civil rights era. Yet the hoped-for cultural change and reduction, if not elimination, of discrimination from 1989 through 2015, is not observed, at least, in hiring.

They conclude that their study results point toward the need for strong enforcement of antidiscrimination legislation and provide a rationale for continuing compensatory policies like affirmative action to improve equality of opportunity.

Thanks for stopping by.

P.S.
Study of racial discrimination in hiring in Proceedings of National Academy of Sciences: www.pnas.org/content/114/41/10870.full

A version of this blog post appeared earlier on www.warrensnotice.com.