Showing posts with label Be Positive - Optimism. Show all posts

19 June 2020

People Are Generous

Prosocial: Relating to or denoting behavior which is positive, helpful and intended to promote social acceptance and friendship (www.lexico.com/).
Tasty prosocial behavior (from quizlet.com/240141367/).

Welcome back. With political partisanship and hateful behavior peaking, it’s easy to think people either don’t give a hoot about their fellow human beings or that they’ve narrowed the concept. 

Take heart! A recently published study found human prosociality is alive and well.

Prosociality and Reciprocity
Theoretical models and empirical tests have shown that prosocial behavior is promoted by reciprocity. Forms of reciprocity include helping those in our social networks who have helped us (direct reciprocity); paying forward help we receive from one person to another in our network (generalized reciprocity); giving more in the presence of network members who can reward our giving (reputational giving); and rewarding network members who have given to others (rewarding reputation).

Illustration of four forms of reciprocity, with individuals denoted by letters and help shown by arrows; e.g., in direct reciprocity, B helps A after A helped B (from advances.sciencemag.org/content/6/23/eaba0504).
On their own, each form of reciprocity predicts prosociality; each motivates people to behave in a way that benefits other people. But what happens if we are confronted with multiple forms of reciprocity simultaneously? Will some forms of reciprocity crowd out other forms? For example, will giving solely to gain a positive reputation eliminate gratitude and other more sincere prosocial giving via generalized reciprocity? Does human prosociality break down when multiple forms of reciprocity co-occur?

Testing Prosociality with Co-occurring Forms of Reciprocity
Researchers affiliated with Ohio State and South Carolina universities set out to determine if the forms of reciprocity persist in the presence of other forms. They assessed the robustness of reciprocity with a web-based experiment using Amazon Mechanical Turk in which more than 700 participants interacted. The participants, unseen by and unknown to each other, had no known social network relationship.

For the experiment, the researchers crossed the four forms of reciprocity with three levels of each form. In all, they generated 81 conditions to isolate the effects on prosociality while enabling the different forms to be embedded together.

Participants were provided the information corresponding to different conditions and asked how many, if any, of a 10-point endowment they wanted to give to other people. Helping was costly to the giver and socially beneficial; the points had monetary values to participants, and any point given was doubled.

The researchers found that, with the four forms of reciprocity combined, direct reciprocity did not vary and generalized reciprocity, though strongest in the absence of rewarding reputation, was present across all conditions.


While reputational giving and rewarding reputation were moderated by direct reciprocity, reputational giving promoted giving across all conditions and rewarding reputation failed to increase giving in only one condition--when the person to whom the participant was giving had previously given to the participant.

Wrap Up
With a single exception, all four forms of reciprocity positively predicted giving, regardless of whether the other forms of reciprocity were present or how they were combined.

People overwhelmingly chose to be generous to others at a cost to themselves. And in this experiment, the others were strangers. I think that’s pretty cool. Thanks for stopping by.

P.S.
Study of prosociality and reciprocity in Science Advances journal:
advances.sciencemag.org/content/6/23/eaba0504
Article on study on EurekAlert! website: eurekalert.org/pub_releases/2020-06/osu-ptt052920.php

20 September 2019

Live with Optimism

Welcome back. If you’ve been paying attention, you’ll recall that two weeks ago, I suggested you munch on dark chocolate to stay happy (Depressed? Try Dark Chocolate). Today, going further, I suggest you be optimistic, which can be a stretch with what’s going on in the world. Plus, it’s not as easy as reaching for chocolate. 

Don’t be blue and you’ll
probably live longer.
Here’s the deal. Studies have shown that optimists are less likely to suffer from chronic diseases and die prematurely. And now the latest: Optimism is associated with exceptional longevity, which is commonly defined as living to the age of 85 or older.

Optimism Study
Researchers from Boston University School of Medicine, Veterans Affairs Boston Healthcare System, Harvard Medical School and Harvard T.H. Chan School of Public Health tapped two cohort (longitudinal) studies.

They analyzed data on 69,744 women from the Nurses’ Health Study and 1,429 men from the Veterans Affairs Normative Aging Study. The women were followed for 10 years, 2004 to 2014; the men for 30 years,1986 to 2016.

Both groups completed surveys on overall health and health habits (e.g., diet, smoking and alcohol use) and their level of optimism. The Nurses’ Health Study measured optimism using the Life Orientation Test–Revised; the Normative Aging Study used the Revised Optimism–Pessimism Scale from the Minnesota Multiphasic Personality Inventory-2.

The researchers employed statistical modeling (accelerated failure time models) to assess life span differences associated with optimism, adjusting for demographic factors and health, and then considering the effect of health behaviors. They subsequently used predictive analyses (logistic regression) to evaluate the likelihood of exceptional longevity.

Scoring with Optimism
The study found higher optimism levels associated with increased longevity with both women and men. Women in the highest versus lowest optimism quartile had 15% longer life span and 50% greater odds of celebrating their 85th birthday. Men in the highest versus lowest optimism quartile had 11% longer life span and 70% greater odds of living 85 years.

The results held after accounting for age, demographic factors, chronic diseases, depression as well as health behaviors, including alcohol use, exercise, diet and primary care visits.

Wrap Up
While it’s clear that optimism delivers additional years, it’s not clear precisely how. Nevertheless, earlier work has shown optimism is modifiable, which suggests that promoting optimism might in turn promote longevity.

So, just keep thinking that good things are coming. The future is bright because we can control many important outcomes (like voting). Thanks for stopping by.  


Never mind if the glass is half empty or half full. Drink what’s there, and believe you can refill it.
P.S.
Optimism study in Proceedings of the National Academy of Sciences journal: www.pnas.org/content/early/2019/08/20/1900712116
Articles on study on EurekAlert! and NPR websites:
eurekalert.org/pub_releases/2019-08/buso-net082119.php
www.npr.org/sections/health-shots/2019/09/01/755185560/optimists-for-the-win-finding-the-bright-side-might-help-you-live-longer
Cohort studies: www.medicalnewstoday.com/articles/281703.php
Nurses Health Study: www.nurseshealthstudy.org/
Veterans Affairs Normative Aging Study: www.maelstrom-research.org/mica/individual-study/va-nas
Life Orientation Test: www.midss.org/content/life-orientation-test-revised-lot-r
Revised Optimism-Pessimism Scale: onlinelibrary.wiley.com/doi/abs/10.1002/1097-4679%28199503%2951%3A2%3C205%3A%3AAID-JCLP2270510210%3E3.0.CO%3B2-2

13 September 2019

Do Negative Pep Talks Work?

Welcome back. Growing up, unlike my father or brother, I wasn’t burdened with an abundance of athletic prowess. Any burden I carried pretty much faded after high school.

I’ve blogged about playing baseball, basketball and tennis. Though I have no trouble remembering the coaches, I can’t recall anything they ever said. And that includes locker room pep talks, the focus of a recent study by researchers from the University of California, Berkeley and the University of Toronto.


While that study’s setting is the locker room, the subject is the psychology of leadership. Being positive is usually emphasized for improving your team's or staff's performance. The researchers looked at the effect of getting negative.
Scene from the 1986 movie Hoosiers, where the coach (Gene Hackman) delivers a positive inspirational speech to the team before the regional basketball finals (from thefilmspectrum.com/?p=21716).
Basketball Halftime Speeches
With the permission of 23 high school and college coaches, the researchers recorded 304 half-time speeches during basketball games.

Each talk was rated on the extent to which the coach expressed emotions ranging from positive (pleased, excited, relaxed, inspired) to negative (disgusted, angry, frustrated, afraid). These assessments were then related to how well the team played in the second half.

The researchers also conducted a separate experiment in which participants listened to selected half-time speeches and reported how motivated each speech made them feel.

Should Leaders Be Positive or Negative?
Analysis of the half-time speeches and both the second-half scoring and the participants’ reported motivation showed the same results. Negative half-time speeches work…up to a point.

Expressing negative emotion at halftime pushed the players to perform better in the second half (even if they were ahead at halftime) and had a strong motivating effect.

But extremely negative expressions of emotion--becoming too angry or too negative--impeded performance and lowered motivation.

Wrap Up
The researchers offer that negative emotion can be underrated as a motivational tool. When leaders are trying to correct or redirect behavior, negative emotion can effectively convey their message.

Yet it only works at a moderate level of unpleasantness and can be counterproductive at low and high levels. Further, it only works in short-term instances. Prolonged negative feedback can demoralize.

Knowing how far to go must be tricky. I can’t help wondering how much the response to a leader’s negative emotions, especially anger, would vary with the individual, with gender, age, attitude. Some of us were never particularly gung-ho and resent being harangued. 

This leader might have exceeded an effective level of negative emotion (from www.digi-karma.com/2017/04/25/7-ways-managers-unknowingly-demotivate-employees/).
Anyway, I’ve put up with worse and you probably have, too. Thanks for stopping by.

P.S.
Study of locker room leadership in Jour. of Applied Psychology: psycnet.apa.org/doiLanding?doi=10.1037%2Fapl0000418
Article on study on EurekAlert! website: www.eurekalert.org/pub_releases/2019-08/uoc--wcl081519.php
Movies with the best motivational locker room speeches: www.fandango.com/movie-news/the-best-motivational-locker-room-speeches-747822

01 April 2019

The Change in Popular Music

Welcome back. You probably missed it, but the American Scientist’s digital features editor didn’t. A number of music releases in 2018 reflected STEM topics, you know, science, technology, engineering and mathematics. She identified 11 and expected her list was far from complete. 

K-pop boy-band BTS (video of “DNA”
www.youtube.com/watch?v=MBdVXkSdhwU).
Examples are “DNA” by the K-pop boy-band BTS (song explores the relationship between genetics and a sense of destiny) and “The Prawn Song” by Superorganism, an English indie pop band (song has references to behavioral science, evolutionary biology and microplastics pollution).

Notably, only 1 of the 11 songs on her list contains explicit language or mature content. Whether or not you shake your head reading about R-rated music lyrics, I doubt you’ll be shocked to learn that the lyrics of popular music have become more negative over the years.

That trend was recently documented by researchers from Lawrence Technological University. They used automatic sentiment analysis to characterize the emotions expressed by the lyrics of the most popular songs over the last six-plus decades. Permit me to explain.

Sentiment Analysis
Natural language processing is a branch of artificial intelligence that aims to help computers understand, interpret and manipulate human language. To bridge that gap, it draws upon computer science, computational linguistics as well as other disciplines.

Sentiment analysis, also called opinion mining, is a field of natural language processing. Its goal is to identify and extract opinions about a given subject from written or spoken language.


Billboard 100 logo.
Research Approach
The researchers applied automatic sentiment analysis to the lyrics of 6,150 Billboard 100 songs from 1951 through 2016. The Billboard chart ranks the most popular 100 songs of the week in the U.S. Popularity was originally based on sales and radio airplay and later expanded to include online streaming activity.

Automatic sentiment analysis was used to associate each word or phrase in each song with the set of tones they express. Combining the tones of each song’s words and phrases determined the song’s sentiment. The sentiments of each week’s Billboard 100 songs for each year were then averaged to arrive at a single measure for each year’s sentiment. Lastly, they compared the yearly sentiments to determine the changes over the years.

Changes Over Time

The lyrics of songs released during the mid-1950s were the least angry. Joy was a dominant sentiment in the late-1950s, becoming less so by 2016.

Anger increased gradually from the 1950s through 2015, with the exception of 1982-84, when songs were markedly less angry, and the mid-1990s, when songs were much angrier.

Sadness, disgust and fear also increased gradually over the years, though less than anger. Like anger, disgust was lower in the early 1980s and higher in the mid- and late-1990s. Fear, however, increased in the mid-1980s and 1998-99 and decreased sharply in 1988 and 2000.

Wrap Up
The trends documented in the study reflect changes in people’s tastes, not changes in music. Like me, you may be curious about the causes, particularly why blips occurred in the early 1980s and again in the 1990s.

I think the general decline from the 1950s would be expected. Other than the Korean War, the 1950s were a time of joy at least for whites. The U.S. could do no wrong, and, hey, rock ‘n’ roll got started.

Our trust and beliefs took a hit in the 1960s and ‘70s with the civil rights movement, the radical and countercultural movements, inflation, Vietnam, Watergate and more. Some phenomenal music by the Beatles and others couldn’t stop the decline.

Sugarhill Gang’s 1979 record, Rapper’s Delight
(video www.youtube.com/watch?v=tUqvPJ3cbUQ).
The first rap record to receive major mainstream radio play, “Rapper’s Delight,” was recorded in 1979. It rose to 36 on the Billboard Hot 100, and hip-hop took off. Beyond that, it’s easy to speculate and even easier to be wrong. So, I’ll stop and refer you to your favorite musicologist. Thanks for stopping by.

P.S.
STEM songs of 2018: www.americanscientist.org/blog/science-culture/stem-songs-of-2018
Trend in music lyrics study in Journal of Popular Music Studies: jpms.ucpress.edu/content/30/4/161
Articles on study on ScienceDaily and The Oakland Press websites:
www.sciencedaily.com/releases/2019/01/190124124737.htm
www.theoaklandpress.com/entertainment/songs-have-gotten-angrier-over-the-years-lawrence-tech-researchers/article_17677f9a-0ae0-11e9-9d14-a776e408e925.html
Natural language processing and sentiment analysis:
www.sas.com/en_us/insights/analytics/what-is-natural-language-processing-nlp.html
monkeylearn.com/sentiment-analysis/
en.wikipedia.org/wiki/Sentiment_analysis
Billboard 100: en.wikipedia.org/wiki/Billboard_Hot_100
A bit of history:
www.history.com/topics/1980s/1980s
ourpastimes.com/when-did-rap-music-become-popular-12200036.html

A version of this blog post appeared earlier on www.warrensnotice.com.

25 March 2019

I Fail at Conversation

Conversation partners
(from www.arch.tamu.edu/).
Welcome back. Some of us don’t rate conversation as a strength. We walk away from encounters with new people certain that everything we said between “Hello” and “Hope to see you again” was a hair width above being incomprehensible and boring. Our conversation partners are always impressive. They no doubt think we are…well, they couldn’t possible like us.

Maybe it’s not that bad. Researchers from Cornell, Harvard and Yale universities and the UK’s University of Essex tested conversation partners in five different situations and found a liking gap between what we think and reality. We regularly underestimate how much our conversation partners like us and enjoy our company.

Conversation Tests

 
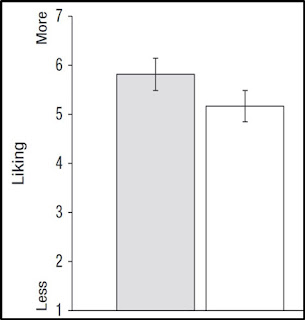
Test 1 had 18 pairs of unacquainted, same-gender participants sit together for a 5-minute conversation with the benefit of icebreaker questions (e.g., Where are you from?).

The participants then answered four questions to measure how much they liked their conversation partners (“I generally liked…” to “I could see myself becoming friends with…”) and four analogous questions to measure how much they thought their conversation partners liked them. Participants also completed scales measuring shyness, narcissism, rejection sensitivity and self-esteem and their demographics.

Given that the four measures of how much participants liked their conversation partners were highly correlated, they were averaged into a single measure, actual liking. Similarly, the four highly correlated measures of how much participants thought their conversation partners liked them were also averaged into a single measure, perceived liking.

The test showed that, after a brief conversation, people significantly underestimated how much others liked them. The shyer the participants, the greater their liking gap.

Liking Gap, Test 1, Rating of conversation partners’ actual liking (left) and perceived liking, with 95% confidence interval error bars (from journals.sagepub.com/doi/full/10.1177/0956797618783714).
An extension of the test had two trained assistants code the videotaped conversations. They were able to predict how much the participants liked one another, indicating actual-liking signals were given, but they could not predict the perceived liking–how much participants thought their partners liked them.

Tests 2 and 3 were similar to Test 1 with more participants and no icebreaker questions. Test 2 also asked what thoughts went into forming impressions of their conversation partners, while Test 3 added mixed gender and longer conversations and questions measuring how much the partners enjoyed the conversation.

Participants again underestimated how much others liked them and how much others enjoyed the conversation. Their most salient thoughts about how others viewed them were more negative than their thoughts about how they viewed others. Participants who had longer conversations liked each other more, but the liking gap persisted no matter the length of the conversation.

Test 4 asked 50 pairs of unacquainted conversation partners in “How to Talk to Strangers” workshops how interesting they would find each other, both before and after their conversation. Participants predicted they would find their conversation partner more interesting than their partner would find them to be, and this mistaken belief grew more mistaken after participants had a conversation.

Liking Gap, Test 4, Actual and perceived interesting ratings before (left) and after conversations, with 95% confidence interval error bars (from journals.sagepub.com/doi/full/10.1177/0956797618783714).
Test 5 had freshman college students answer actual and perceived liking questions with regard to their dorm suite mates at five points over the academic year. The students underestimated how much their suite mates liked them until the end of the year. That final departure might be because the students were making decisions about rooming together the following year, which could have forced discussions that revealed liking.

Wrap Up
The study repeatedly found that people systematically underestimate how much their conversation partners like them and enjoy their company. The liking gap persisted after short or long conversations, over the course of a year and whether the participants were students or members of the general public.

People tend to hold themselves in high regard; however, conversation appears to be a domain in which people display uncharacteristic pessimism about their performance. Clearly, conversations are a greater source of happiness than we realize, as others like us more than we think. Thanks for stopping by.

P.S.
Study of conversation liking gap in Psychological Science journal: journals.sagepub.com/doi/full/10.1177/0956797618783714
Article on study on TIME website: time.com/5396598/good-first-impression/

A version of this blog post appeared earlier on www.warrensnotice.com.

21 March 2019

Extend Your Happiness

Welcome back. Tell me. Is everything feeling sort of same old, same old? I’m sorry. Hey, I came across something you may want to try. It might rekindle the joy of first-time experiences, before those experiences become way too familiar.

Hedonic Adaptation
Psychologists refer to the tendency to return to our relatively stable level of happiness after major positive or negative events or life changes as hedonic adaptation or the hedonic treadmill. Researchers from the University of Missouri and University of California, Riverside, posed two reasons for hedonic adaptation in a study published in 2012.

Illustration of hedonic adaptation or treadmill (from
www.conversion-uplift.co.uk/glossary-of-conversion-marketing/hedonic-treadmill/).
The first involves bottom-up processes: Emotions generated by the positive change decline, and happiness can’t be sustained. You buy a new car, but it doesn’t take long before you hardly notice the new car features you thought were so cool.

The other reason happiness ebbs involves top-down processes: Increased aspirations for more positivity. Your new, higher paying job is your new normal, and now you want more.

That study also laid out two approaches to moderate the hedonic adaption processes--continued appreciation of the life change and continued variety in change-related experiences.

Keeping Things New
A 2018 study by researchers from The University of Chicago and The Ohio State University expanded on those approaches. They tested ways to continue appreciating things, preventing them from being taken for granted, by continuing the variety. Their focus was consuming familiar things.

Air-popped popcorn to be eaten
with fingers or chopsticks.
In one experiment, 68 participants ate popcorn equally fast, yet half of the participants dined with fingers in the usual way and half used chopsticks. Those who ate popcorn in the different way, using chopsticks, paid more attention to the popcorn and enjoyed it more than those who used their fingers.
 

Water to be sipped
from a flower vase.
For another experiment, 300 participants took five sips of water. One hundred of the participants sipped in the usual way; 100 sipped using an unconventional method they had come up with (e.g., out of a martini glass or lapping like a cat); and 100 sipped using a different unconventional method for each of the five sips.

Participants who sipped water using a different method for each sip enjoyed their water the most, and their enjoyment remained constant for the five sips. While those who sipped water the other two ways enjoyed it less, the enjoyment of those who used unconventional methods also held steady for the five sips.

Wrap Up

The study demonstrated that adopting new and unconventional ways to interact with things--even things as common as popcorn and water--invites a first-time perspective.

Try it. What do you have to lose? If something starts to feel same old, same old, interact with it in a different way. As William Cowper wrote in his 1785 poem The Task, "Variety is the very spice of life, that gives it all its favor.”

Enjoy! And thanks for stopping by.

P.S.
Hedonic adaptation: en.wikipedia.org/wiki/Hedonic_treadmill
2012 study of hedonic adaptation in Personality and Psychology Bulletin: journals.sagepub.com/doi/abs/10.1177/0146167212436400
Article on 2012 study on Psychology Today website: www.psychologytoday.com/us/blog/the-science-success/201208/how-keep-happiness-fading
Study of consuming familiar things in new ways in Personality and Psychology Bulletin: journals.sagepub.com/doi/full/10.1177/0146167218779823
Article on study on LiveScience website:
www.livescience.com/62854-eat-popcorn-with-chopsticks.html

A version of this blog post appeared earlier on www.warrensnotice.com.

12 August 2014

Positive Reporting Addendum

Last Friday’s blog post, Reporting Exercise Research, suggested that media reports should be more positive to encourage their readers or at least make them happy. Even if you weren’t around in the 1940s when the song came out, you’ve probably heard "Ac-Cent-Tchu-Ate the Positive," music by Harold Arlen, lyrics by Johnny Mercer.

Today’s addendum offers links to a more-or-less chronological sample of the many that have performed the song over the years. You might listen to one or compare a few. At the moment, I’m kind of partial to Ella Fitzgerald’s and Dr. John’s versions. Contrary to what I was sure I remembered, the song was not used in any Disney animated feature. (A link to the lyrics is appended.)


Johnny Mercer recorded the song with The Pied Pipers and Paul Weston's orchestra on October 4, 1944. (www.youtube.com/watch?v=f3jdbFOidds)
Bing Crosby and The Andrews Sisters recorded the song on December 8, 1944. (www.youtube.com/watch?v=fZUmAbi0Vm4) That year, he also sang it with Sonny Tufts (both in blackface no less) in the movie, Here Come the Waves, for which it was a 1945 academy award nominee for best song.
Here’s a recording of Louis Armstrong and his orchestra performing the song live at New York City’s nightclub Zanzibar on New Year’s Eve, 1945. (www.youtube.com/watch?v=BC7DO-luqYw)
Peggy Lee performed the song many times, especially between 1949 and 1955. (www.youtube.com/watch?v=pUdFIPknB_Y)
Sam Cooke recorded the song for his Encore album, 1958. (www.youtube.com/watch?v=lnErt_ff8-w)
Perry Como added the song to his Saturday Night with Mr. C album, 1958. (www.youtube.com/watch?v=gifkCgoJ7SY)
Ella Fitzgerald included the song on her 1961 Harold Arlen Songbook Album. (www.youtube.com/watch?v=fo6VVt7XvAI)
Aretha Franklin recorded the song for Columbia Records’ The Electrifying Aretha Franklin album in 1962. (www.youtube.com/watch?v=4IP9h40z0sk)
Dr. John played and sang the song for the movie, The Mighty Ducks, 1992. (http://www.youtube.com/watch?v=DqEx9rZ7jTI)
P.S.

Background and Lyrics:
en.wikipedia.org/wiki/Ac-Cent-Tchu-Ate_the_Positive
www.lyricsmania.com/accentuate_the_positive_lyrics_johnny_mercer.html

08 August 2014

Reporting Exercise Research

Welcome back. Do you know what I find depressing about exercise? Not the jogging or stretching or stationary bike or even free weights; none of those. It’s the way the media reports exercise research. They’re so negative.

Time.com recently summarized a Centers for Disease Control and Prevention (CDC) report under the header 1 in 4 Americans admit doing no exercise at all. I bet Time Inc. wouldn’t have folded if it had written Only 1 in 4 Americans does no exercise! or 3 of 4 Americans exercise! (Note the exclamation point.) Why can’t the media be more positive?

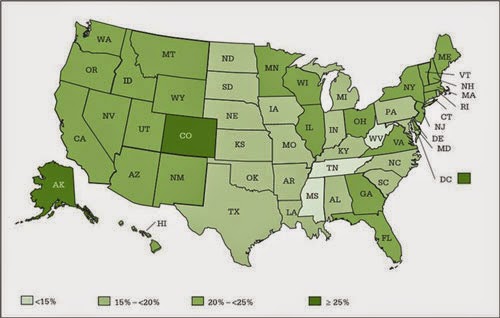
Proportion of adults by state that meet aerobic and muscle-strengthening guidelines – Behavioral Risk Factor Surveillance System, 2011 (CDC report)
Make it Positive

Consider three investigations that I filed over the past 18 months, waiting for the right moment. Each was based on interviews or self-reported surveys and comparisons with physical data (accelerometer measurements) collected on subsets of those surveyed. Although it wasn’t necessarily the aim of the investigation, each found people overreported the amount of exercise they did and underreported their sedentary time.

These surveys weren’t taken door-to-door out here in the Wisconsin hinterlands where there aren’t many doors. One, conducted by New York City’s Department of Health and Mental Hygiene, began with 3,811 telephone interviews; one by Louisiana’s Pennington Biomedical Research Center was an analysis of US National Health and Nutrition Examination Survey (NHANES) data on 3,725 people; and the third, a Norwegian study, included 1,751 people.

If mainstream media had grabbed these studies they might have headlined People exaggerate exercise and understate couch time. Would it be so bad to write People in the zone forget time when exercising and recovering?

Choose positivity over negativity.
(multiple websites)
Conflicting Results

And the media rushes out its negative headlines, though tomorrow’s research findings may differ from today's. Why can’t they just wait until there’s research that encourages people or makes them happy?

Last month, for example, the Southwestern Medical Center of the University of Texas, with a contributor from the University of South Carolina, reported an analysis of NHANES data from 2,223 people. They found sedentary behavior appears to have an inverse association with fitness, from which Time.com somehow headlined An hour of exercise can make up for a day of sitting down. While that might have made some people happy, it would have been better to state Exercise isn’t needed if you don’t sit. Better but not best. For the best headline, they would have had to wait for the next study.

Collaborators from the American Cancer Society, University of Texas School of Public Health and the Cooper Institute reported that the association between prolonged sedentary time and cardio-metabolic biomarkers is markedly less pronounced when taking fitness into account. Time.com reported that as Sitting all day isn’t as bad if you do this. Clearly, they missed the opportunity to combine the two studies, avoid open-ended headers and announce Exercise isn’t needed if you stay fit.

Wrap Up

I have to admit that making that last statement might hamper reporting of still another study from last month, this one from Stanford University. That research, which was also based on analysis of NHANES data, focused on obesity and concluded that declining physical activity rather than caloric intake has contributed significantly to the increase in obesity

Smile if you’re always positive.
 (multiple websites)

Time.com headlined Lack of exercise, not calories, makes us fatter. I would have preferred Eat all you want if you exercise; however, I’m willing to combine all of last month’s findings and announce You may be able to eat all you want if you stay fit. No one would ever figure that one out, but it would make them happy.

You see? It’s all in the presentation. Keep it positive. Thanks for stopping by. I hope it was encouraging.

P.S.


Time article and CDC report:
time.com/2987896/america-sedentary-states-exercise/
www.cdc.gov/physicalactivity/downloads/pa_state_indicator_report_2014.pdf
New York City comparison of self-reported and accelerometer-measured activity:
www.nyc.gov/html/doh/downloads/pdf/epi/epiresearch-pa_measures.pdf
Pennington Biomedical Research Center analysis of NHANES data:
www.ijbnpa.org/content/10/1/126
CDC’s National Health and Nutrition Examination Survey (NHANES) Program:
www.cdc.gov/nchs/nhanes.htm
Norwegian comparison of self-reported and accelerometer-measured activity: journals.lww.com/acsm-msse/Abstract/2014/01000/Comparison_of_Self_reported_versus.15.aspx

University of Texas study in Mayo Clinic Proceedings and article on Time website:
www.mayoclinicproceedings.org/article/S0025-6196(14)00382-6/abstract
time.com/2967417/exercise-sitting-down-nhanes/?xid=newsletter-brief
American Cancer Society led study and article on Time website:
www.mayoclinicproceedings.org/article/S0025-6196%2814%2900431-5/abstract
time.com/2977994/sitting-all-day-isnt-as-bad-if-you-do-this/

Stanford University study in American Journal of Medicine and article on Time website:
www.amjmed.com/article/S0002-9343(14)00191-0/abstract
time.com/2964554/its-lack-of-exercise-not-calories-that-make-us-fat-study-says/