Showing posts with label Conversation. Show all posts

16 June 2023

Global Language Loss

Global language experts estimate that, without intervention, about one language will be lost every month for the next 40 years.

Welcome back. My 2012 blog post on linguistics may have only been a concern to me--that “mom” is replacing “mother” and “no problem” is replacing “you’re welcome” (see Linguistic Longings)--but today’s topic, the loss of languages, has been described as a linguistic crisis. Reflecting its importance, the recently published study, led by researchers with the Max Planck Institute for Evolutionary Anthropology, has more than 100 contributors affiliated with institutions from around the world.

A key reason for the wide-ranging involvement is that most if not all of the contributors were involved in the development of the Grambank database, which the study introduces and relied on to answer long-standing questions about global linguistic diversity--in essence, the differences among different languages and the ways people communicate with one another.

Countries with most languages spoken in 2021 (from www.statista.com/chart/3862/countries-with-the-most-spoken-languages/).
One of those questions is what the consequences of language loss will be on our understanding of linguistic diversity.

Grambank Database
Grammar defines the rules of a language--words, sounds, how they are combined and interpreted. A language’s grammatical elements include word order, tense, comparatives (words that express ‘bigger’ or ‘smaller’) and whether the language has gendered pronouns.

There are about 7,000 spoken languages in the modern world and published grammatical descriptions for about 4,300 languages.

Grambank is the world’s largest publicly available comparative grammatical database. With more than 2,400 languages and 400,000 data points, it has encoded over half of all possible grammar information that can be extracted from existing data sources.

Language Loss
The loss of languages has occurred throughout human history. What’s new is that, due to social, political and economic pressures, the speed of loss has accelerated. The study’s co-first author from the University of Colorado at Boulder described it as if, while mapping the human genome, scientists saw the genes themselves rapidly disappearing before their eyes.

This global language loss is not evenly distributed. Among the regions at higher risk of losing indigenous languages are Aleut in Alaska, Salish languages of the Pacific Northwest, Yagua and Tariana in South America, and languages of Kuuk-Thaayorre and Wardaman in Northern Australia.

Characterizing the Loss
The comprehensiveness of Grambank allowed effective investigation of the potential loss of linguistic knowledge using a metric borrowed from the field of ecology, “functional richness.” This metric quantifies the area occupied by a species (languages in the study) by the set of features and estimates the diversity the data represent.

Computing this metric, first with all languages, and then only with languages that are not endangered, the researchers were able estimate the potential loss in structural diversity. They found that, although functional richness declines only moderately on a global scale with the loss of languages that are now under threat, the consequences of language loss vary significantly across regions.

Wrap Up
The researchers conclude that the pronounced reduction of the functional space occupied by languages, even in regions with many non-threatened languages, will undermine the ability to investigate the basic structures of language and the diverse expressions used to encode them.

Without sustained efforts to document and revitalize endangered languages, the linguistic window into human history, cognition and culture will be seriously fragmented.

Recognizing the state of language endangerment, the United Nations has declared this the International Decade of Indigenous Languages to promote language preservation, documentation and revitalization.

Thanks for stopping by.

P.S.
Study of Grambank analyses of linguistic diversity in Science Advances journal: www.science.org/doi/10.1126/sciadv.adg6175
Article on study on EurekAlert! website: www.eurekalert.org/news-releases/986975
UN International Decade of Indigenous Languages 2022-2032: www.un.org/development/desa/indigenouspeoples/indigenous-languages.html

03 June 2022

Constructive Feedback

Welcome back. Given my years and positions in academia and government, I’m well versed in giving constructive feedback, probably too well versed for some recipients. I never hesitated to offer feedback if I thought it could help. Apparently, that’s not the norm.

Studies have suggested that people withhold feedback to avoid negative outcomes for themselves or others, or due to lack of motivation. But a recently published study by researchers affiliated with Harvard and the University of California, Berkeley found that people may hold back simply because they underestimate the recipients’ desire for feedback.

I’ll summarize that recent study and hope you find it of interest.

Pilot Study and Experiments
The researchers conducted a pilot study and five experiments.

Pilot Study: Researchers with a blemish on their face (e.g., smeared lipstick or chocolate) approached survey-takers on a university campus. Of the 155 who reported noticing the blemish, only 4 told the researcher about it, demonstrating that people seldom give constructive feedback in a field setting.

Survey-takers' reasons for not providing feedback in pilot study (from www.apa.org/pubs/journals/releases/psp-pspi0000393.pdf).
Experiment 1: The researchers recruited 721 adults through Prolific Academic and had them imagine either giving or receiving feedback about 10 different workplace situations (e.g., a rip in the seat of one’s pants, making an error in a report).

“Givers” consistently underestimated the “receivers’” desire for constructive feedback, an effect that was stronger when issues seemed more consequential. The imagined relationship between givers and receivers (friends, acquaintances or strangers) had no effect.

Predicted and actual desire for constructive feedback for more consequential scenarios (from www.apa.org/pubs/journals/releases/psp-pspi0000393.pdf).
Experiment 2: The researchers had 403 adults from Prolific Academic interact in pairs to recall an instance when one participant had the potential to give or receive feedback and the other to give feedback on the recalled memory. Givers consistently underestimated how much receivers wanted constructive feedback.

Experiment 3:
To test how underestimating the desire for feedback might differ between people who know each other well, the researchers enlisted 50 pairs of friends, roommates or romantic partners for an online Zoom experiment.

One member of each pair was randomly assigned to be the giver, generating constructive feedback he or she wanted to share, and the other to be the receiver. Participants first predicted how they would feel giving or receiving feedback, then interacted, and finally reported how giving or receiving the feedback actually felt.

Givers again underestimated the receivers’ desire for feedback. The underestimation was predicted by the givers’ beliefs about the value for the feedback as well as by the givers’ predictions of their own discomfort.

Experiment 4: The researchers recruited 600 adults from Prolific Academic to test two potential interventions to reduce underestimating the receivers’ desire for feedback. One intervention asked givers to imagine someone else gave the feedback; the second was designed to promote perspective-taking by asking givers to simulate what it would be like to receive feedback themselves.

While both interventions led to more accurate predictions of receiver desire for feedback, the perspective-taking givers were significantly more accurate. This suggests that givers may be focusing too much on their own experience (anticipating discomfort and relational harm) or not fully considering the receiver’s potentially positive experience (e.g., the value of the feedback).

Experiment 5: The final experiment enlisted 102 pairs of students for one member of each pair to give feedback to the other member in a financially incentivized ($50) public speaking competition. Receivers who received more feedback had higher percentage score improvements between their practice and final speeches. Suffice it to note that givers underestimated the receivers’ desire for feedback.

Wrap Up
People may forego the opportunity to provide constructive feedback due to concerns about negative interpersonal consequences or lack of motivation. The study demonstrates another reason is that people consistently underestimate others’ desire for constructive feedback, especially because they underestimate the value of their feedback. 

Wise comment from Yoda (from memegenerator.net/instance/80945126/).
The researchers emphasize that feedback is key to personal growth and improvement and can correct problems that are otherwise costly to the recipient. Don’t hold back. Thanks for stopping by.

P.S.
Study of underestimated desire for feedback in Journal of Personality and Social Psychology: www.apa.org/pubs/journals/releases/psp-pspi0000393.pdf
Article on study on EurekAlert! website: www.eurekalert.org/news-releases/946947
Prolific Academic: www.prolific.co/

10 January 2020

Liars, Lies and Lying

Welcome back. At the close of 2019, the most viewed post of the more than 660 on this blog was Facial Expressions Addendum

That 2015 post described the Facial Action Coding System for human expressions by Paul Ekman and colleagues. Facial micro-expressions usually occur when a person is deliberately or unconsciously concealing a feeling, which might be lying. (I refer you to the TV show Lie to Me, if you can find it.)

Are you a good liar, or does it
show
(from Walt Disney Productions)?
I hope there’s still interest in lying, because that’s the subject of today’s post. A recent study by researchers affiliated with Maastricht University in the Netherlands and the U.K.’s University of Portsmouth examined the association between deception ability and lie prevalence and characteristics as well as how “good liars" use deception strategies.

Lying Survey
The researchers surveyed 194 participants (175 U.S. and 19 Indian citizens) through Amazon Mechanical Turk with a two-part online questionnaire. Definitions were provided.

In Part 1, participants rated how good they were at deceiving others (1-very poor to 10-excellent); they estimated the number of lies they told during the past 24 hours; and they responded to multiple-response questions about those lies: (i) types of lies told (white lies, exaggerations, lies of omission/concealment, lies of commission/fabrications or embedded lies), (ii) to whom they lied (family, friend, employer, colleague, authority figure or other) and (iii) the mediums of deception (face-to-face, phone, social media, text message, email or other).

In Part 2 of the questionnaire, participants explained strategies they use when telling lies; how important they consider verbal and nonverbal strategies are for lying successfully (1–not important to 10–very important); and which verbal strategies they use from a predetermined list (e.g., reporting from previous experience, providing unverifiable details, telling a plausible story).

Lie Prevalence and Characteristics
Using the self-reported ratings of deception ability, the researchers categorized participants as poor liars (51), neutral liars (75) or good liars (68). Of the poor liars, 70% were female, while 53% of the good liars were male. There was no significant association between deception ability and education level.

The participants told an average of 1.6 lies during the last 24 hours (from 0 to 20 lies), but that was highly skewed. The six most prolific liars accounted for nearly 39% of the lies, and 39% of the participants reported telling no lies.

In general, good liars told the most lies per day, mainly white lies and exaggerations to colleagues, friends or others, such as romantic partners, not to family, employers or authority figures. They told most lies face-to-face.

Bar charts showing the participants’ use of different deception types during the past 24 hours; error bars are 95% confidence intervals (from journals.plos.org/plosone/article?id=10.1371/journal.pone.0225566).
Deception Strategies
The only statistically significant association between deception ability and deception strategy was with “No strategy.” Nevertheless, all liars judged behavioral strategies important for deceiving successfully.
Number (N) of surveyed participants using the listed deception strategies (modified from journals.plos.org/plosone/article?id=10.1371/journal.pone.0225566).
Favoring face-to-face deception, good liars commonly used the verbal strategies of embedding lies into truthful information and keeping their statements clear, simple and plausible. Good liars were also more likely to match the amount and type of details in their lies to the truthful part of their story and provide unverifiable details.

Poor liars were more likely to rely on avoidance, being intentionally vague or omitting certain details.

Wrap Up
The study did not survey a statistically random sample of any defined population, yet the results serve well for an exploratory study, as intended, especially in portraying good liars.

Not to spoil the moment, but I can’t leave the topic of lying without commenting on the president…Oh, never mind. Unlike when he says, “Everyone knows that,” everyone does know that. Thanks for stopping by.

P.S.
Study of lying in PLOS One journal: journals.plos.org/plosone/article?id=10.1371/journal.pone.0225566
Article on study on EurekAlert! website: www.eurekalert.org/pub_releases/2019-12/uop-mtt122019.php

03 January 2020

Nonverbal Exclamation Emotions

Happy 2020! And welcome back. I hope you won’t mind if I review a study published about a year ago. It’s not that I just found the study. Well, it is, sort of. The study was buried on my list of possible blog topics. I noticed it while deleting files to prepare for the new year, and I think it’s an ideal kickoff for 2020.

One of the more pleasant
nonverbal exclamations.
The topic is nonverbal exclamations, such as ohhh or oops. They communicate feelings that can be understood immediately. They are essential to recognizing emotion from vocalizations.

A team of researchers, affiliated with the University of California, Berkeley, Washington University in St. Louis and Sweden’s Stockholm University, set out to better define the relationship between these vocal bursts and emotions. For example, how many distinct kinds of emotions can be expressed? Is the recognition of emotion expressions discrete or continuous?

Collection and Initial Assessment of Vocalizations
The researchers recorded 2,032 vocal bursts by 56 male and female professional actors and non-actors from the U.S., India, Kenya and Singapore responding to emotionally evocative scenarios.

They then had more than 1,000 adults (via Amazon's Mechanical Turk) listen to and evaluate the vocal bursts for the emotions and meaning they conveyed, whether the tone was positive or negative and other characteristics.

Statistical analysis placed the vocal bursts into at least two dozen categories, including amusement, anger, awe, confusion, contempt, contentment, desire, disappointment, disgust, distress, ecstasy, elation, embarrassment, fear, interest, pain, realization, relief, sadness, surprise (positive) surprise (negative), sympathy and triumph.

Providing Contexts for Vocal Bursts
The researchers sampled YouTube video clips that evoked the 24 emotions. Vocal bursts extracted from videos (e.g., puppies being hugged, spellbinding magic tricks) were judged by 88 adults and categorized into 24 shades of emotion.

Here’s the best part. They organized all of the data into a natural language semantic space in the form of an online interactive audio map (see P.S. or figure captions for link).

Graphical depiction of online interactive audio map of emotions conveyed by nonverbal exclamations (from www.alancowen.com/vocs).
Enlarged view of top-left section of online interactive audio map; various colored spots provide audio of the gradient mix of emotions (from www.alancowen.com/vocs).
You slide your cursor over any of the categories of emotion and hear the exclamations--surprise (gasp), realization (ohhh), fear (scream). Then you find the categories are linked by gradients with continuously varying meaning. In the map’s embarrassment region, you might find a vocalization recognized as a mix of amusement, embarrassment and positive surprise.

Wrap Up
The researchers suggest that, along with linguistics applications, the map should be useful in helping teach voice-controlled digital assistants and robots to recognize human emotions based on sounds. Another possible application would be helping to identify specific emotion-related deficits in people with dementia, autism or other emotional processing disorders.

The only problem I find is the relative difficulty of examining the map on a smartphone or even a tablet rather than a laptop or desktop computer. Maybe it’s just my devices. I hope you’ll manage; it’s really cool. Thanks for stopping by.

P.S.
Study of emotions conveyed by nonverbal vocalizations in American Psychologist journal: psycnet.apa.org/doiLanding?doi=10.1037%2Famp0000399
Article on study on ScienceDaily website: www.sciencedaily.com/releases/2019/02/190205144343.htm

Interactive audio map of emotions conveyed by nonverbal vocalizations: www.alancowen.com/vocs
The interactive audio map is also included in the UC Berkeley press release: news.berkeley.edu/2019/02/04/audio-map-of-exclamations/

15 November 2019

Speaking Rate and Information Revisited

Welcome back. Some people speak faster than others, right? But as the study I blogged about a couple of years ago found, regardless of how fast people speak, they convey about the same amount of information in a given period of time (Speaking Rate and Information).

Revisiting time spent pawing
through the lexical information.
To reach that conclusion, the Brown University researcher analyzed some 2,400 two-sided telephone conversations among 543 speakers and interviews with 40 speakers. He estimated information rate from two linguistic criteria, lexical (dictionary definition) and structural (syntax). The speakers were from across the U.S., and all conversations were in English.

Being worldly wise and intrigued by languages and linguistics, you of course wonder: Do speakers of other languages also convey the same amount of information in a given period of time? 


Take Spanish. Even if you don't speak Spanish, you’ve probably heard it spoken. Do Spanish speakers convey information at the same rate as English speakers?

Language Information Rates

Well, even if you don’t wonder, a team of researchers affiliated with France’s University of Lyon, the University of Hong Kong, New Zealand’s University of Canterbury and South Korea’s Ajou University set out to learn the answer.

They gave 170 native speakers of 17 different languages (10 speakers per language) 15 semantically similar texts to read in their native language (Basque, Cantonese, Catalan, English, Finnish, French, German, Hungarian, Italian, Japanese, Korean, Mandarin, Serbian, Spanish, Thai, Turkish and Vietnamese). The speakers were instructed to familiarize themselves with the texts, then read them aloud at a comfortable pace with good pronunciation while they were recorded.

Through quantitative analysis, the researchers found that the speech rate (syllables per second) and the average information density of the syllables uttered for each language were quite different. Yet when the speaker combined the two properties, the information rate balanced. Similar amounts of information were conveyed in a given period of time (about 39 bits/second plus or minus 5 bits/second).

Languages such as Spanish had higher speech rates and lower information densities; Asian languages such as Vietnamese had slower speech rates and high information densities. 

The graphed data are the average information density (ID) and corresponding speech rates (SR) for languages noted at top. (There is one value of ID per language and as many values of SR as texts read by individual speakers.) The relationship between SR and ID is represented by the yellow straight line (linear regression) and the black curved line (locally estimated scatterplot smoothing regression). Both show SR decreases with increasing ID (from advances.sciencemag.org/content/5/9/eaaw2594).
Wrap Up
The researchers’ goal was to characterize the baseline by analyzing controlled speech instead of speech in more casual, unpredictable settings. They expect, however, that the strength of their findings would decrease along a continuum from very carefully pronounced content to very informal interactions. For the latter, understanding is heavily reliant on contextual and pragmatic factors rather than the linguistic information itself.

I’m way out of my league, but a significant change of information rate with casual conversation doesn’t seem to jive with the earlier study of English speakers, which did not control speech. People were found to converse within relatively narrow bounds of communication. The speakers either spoke quickly or provided high information content, but not both, possibly to avoid providing too much or too little information in a given period of time.

That seems reasonable for other languages, at least for most speakers. Anyway, thanks for stopping by.

P.S.
Multi-language information rate study in Science Advances journal: advances.sciencemag.org/content/5/9/eaaw2594
Articles on study on EurekAlert! and Discover websites:
www.eurekalert.org/pub_releases/2019-09/c-sir090419.php
blogs.discovermagazine.com/d-brief/2019/09/04/spoken-languages-convey-information-at-the-same-rate-study-finds/#.XXLY6IVOmUB 

31 May 2019

Response to Diversity

Welcome back. Blogging about my most memorable birthday cake years ago, I devoted most of the post to describing the people in the small Upstate New York city where I grew up in the 1940s and ‘50s (Accented Birthday Cake).

Many were first generation Americans, but unlike large cities, there were no concentrations from any one country or conversant in any one language. Being dispersed and immersed, they had to learn some words of English if they were to communicate beyond the family.


Warren’s maternal
grandparents, 1946.
A Proverbial Melting Pot
I wrote about my grandmother from Eastern Europe or possibly the Russian Empire, who could get by in a handful of languages, including heavily accented English. (My grandparents spoke English to me, but not to each other.)

Dominic, who owned the food market near my father’s store, would prepare a sandwich for me, speaking Italian to himself or a helper and a mix of English and Italian to me. (No, I’m not Italian nor do I speak it.)

A school classmate’s family owned a diner, where they spoke English with patrons, Greek to each other and both languages with their children.

Our French-Canadian neighbors would switch fluently between French and English.

We never thought twice if someone didn’t speak English in public, yet a recent survey found that now seems to bother some people.

Americans’ Views of Diversity
The online survey was conducted to gauge Americans’ view about the impact of diversity and the best way to achieve it. Data were provided by 6,637 U.S. adults from the Pew Research Center’s American Trends Panel in early 2019. Here is a sample, only a sample, of the results.

Hearing a Foreign Language
Overall, about 29% were bothered some or a lot to hear people speaking anything other than English in public. Those bothered most were over 65 years old (I’m stunned), less educated and Republican or Republican leaning.

Pew Research Center Survey (see P.S.)
Diversity’s Value and Impact
A clear majority (76%) said that racial and ethnic diversity is at least somewhat good for the U.S. The less educated and Republicans or Republican-leaning responders weren’t quite as convinced, but well over half were.

Pew Research Center Survey (see P.S.)
Expanding on diversity, the majority (64%) said that having many different races and ethnicities has a positive impact on the country’s culture. That view was most strongly held by Democrats and Democrat-leaning responders, yet half of Republicans and Republican-leaning responders agreed.

Workplace Diversity
Three-fourths of the survey responders said it was somewhat or very important for employers to promote workplace diversity; however, a like number of responders said that race and ethnicity should not be a factor in hiring or promotions.

Pew Research Center Survey (see P.S.)
School Diversity
The survey asked the relative importance of having students attend local versus racially and ethnically mixed schools. Overall, most (54%) favored local schools, regardless of the schools’ level of diversity. The percentages differed significantly between white and black responders, with nearly double the number of blacks favoring racially and ethnically mixed schools.

Pew Research Center Survey (see P.S.)
Wrap Up
The survey found that, whether white, black, Hispanic or Asian, most Americans have some interactions daily with people of other races or ethnicities. That’s a start.

And, again, most Americans favor diversity and recognize its value to our culture. I’m afraid those who don’t, those who are bothered to hear foreign languages spoken in public, may just have to get used to it. The Census Bureau projects that blacks, Hispanics, Asians and other racial minorities will make up the majority of the U.S. population by 2050.

Thanks for stopping by.

P.S.
Pew Research Center Survey: www.pewsocialtrends.org/2019/05/08/americans-see-advantages-and-challenges-in-countrys-growing-racial-and-ethnic-diversity/

All tables are from the cited Pew Research Center survey. The following applies to all: Whites, blacks and Asians are those who report being one race and non-Hispanic. Hispanics are of any race. Asians were interviewed in English only. Though included in the totals, they may not be shown separately due to small sample size.

25 March 2019

I Fail at Conversation

Conversation partners
(from www.arch.tamu.edu/).
Welcome back. Some of us don’t rate conversation as a strength. We walk away from encounters with new people certain that everything we said between “Hello” and “Hope to see you again” was a hair width above being incomprehensible and boring. Our conversation partners are always impressive. They no doubt think we are…well, they couldn’t possible like us.

Maybe it’s not that bad. Researchers from Cornell, Harvard and Yale universities and the UK’s University of Essex tested conversation partners in five different situations and found a liking gap between what we think and reality. We regularly underestimate how much our conversation partners like us and enjoy our company.

Conversation Tests

 
Test 1 had 18 pairs of unacquainted, same-gender participants sit together for a 5-minute conversation with the benefit of icebreaker questions (e.g., Where are you from?).

The participants then answered four questions to measure how much they liked their conversation partners (“I generally liked…” to “I could see myself becoming friends with…”) and four analogous questions to measure how much they thought their conversation partners liked them. Participants also completed scales measuring shyness, narcissism, rejection sensitivity and self-esteem and their demographics.

Given that the four measures of how much participants liked their conversation partners were highly correlated, they were averaged into a single measure, actual liking. Similarly, the four highly correlated measures of how much participants thought their conversation partners liked them were also averaged into a single measure, perceived liking.

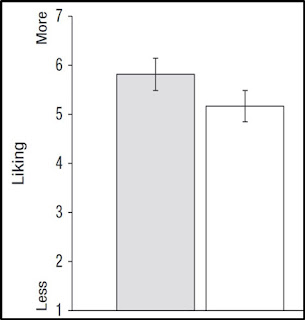
The test showed that, after a brief conversation, people significantly underestimated how much others liked them. The shyer the participants, the greater their liking gap.

Liking Gap, Test 1, Rating of conversation partners’ actual liking (left) and perceived liking, with 95% confidence interval error bars (from journals.sagepub.com/doi/full/10.1177/0956797618783714).
An extension of the test had two trained assistants code the videotaped conversations. They were able to predict how much the participants liked one another, indicating actual-liking signals were given, but they could not predict the perceived liking–how much participants thought their partners liked them.

Tests 2 and 3 were similar to Test 1 with more participants and no icebreaker questions. Test 2 also asked what thoughts went into forming impressions of their conversation partners, while Test 3 added mixed gender and longer conversations and questions measuring how much the partners enjoyed the conversation.

Participants again underestimated how much others liked them and how much others enjoyed the conversation. Their most salient thoughts about how others viewed them were more negative than their thoughts about how they viewed others. Participants who had longer conversations liked each other more, but the liking gap persisted no matter the length of the conversation.

Test 4 asked 50 pairs of unacquainted conversation partners in “How to Talk to Strangers” workshops how interesting they would find each other, both before and after their conversation. Participants predicted they would find their conversation partner more interesting than their partner would find them to be, and this mistaken belief grew more mistaken after participants had a conversation.

Liking Gap, Test 4, Actual and perceived interesting ratings before (left) and after conversations, with 95% confidence interval error bars (from journals.sagepub.com/doi/full/10.1177/0956797618783714).
Test 5 had freshman college students answer actual and perceived liking questions with regard to their dorm suite mates at five points over the academic year. The students underestimated how much their suite mates liked them until the end of the year. That final departure might be because the students were making decisions about rooming together the following year, which could have forced discussions that revealed liking.

Wrap Up
The study repeatedly found that people systematically underestimate how much their conversation partners like them and enjoy their company. The liking gap persisted after short or long conversations, over the course of a year and whether the participants were students or members of the general public.

People tend to hold themselves in high regard; however, conversation appears to be a domain in which people display uncharacteristic pessimism about their performance. Clearly, conversations are a greater source of happiness than we realize, as others like us more than we think. Thanks for stopping by.

P.S.
Study of conversation liking gap in Psychological Science journal: journals.sagepub.com/doi/full/10.1177/0956797618783714
Article on study on TIME website: time.com/5396598/good-first-impression/

A version of this blog post appeared earlier on www.warrensnotice.com.