28 November 2014

Chocolate for Health

A cacao tree with ripe pods of cacao.
(www.loizadark.com/index.html)
“You’re kidding,” I said, the first time I saw hand-sized, football-shaped pods growing from the trunk and branches of a small tree. “That’s cacao?”

We sliced open a pod to examine the beans, which could have been processed to produce cocoa or chocolate if cacao growing in Puerto Rico hadn’t ended long before my “discovery” in that abandoned field in the 1960s. (Not to worry, chocolate lovers; cacao growing has returned along with artisan chocolate production.)  


A cacao pod cut open to expose
the mucilage-covered beans.
(www.loizadark.com/index.html)
Welcome back. I can’t delay this topic any longer; I am engulfed in chocolate and I don’t mean Halloween leftovers. Research reports on the potential health benefits of chocolate or at least of flavonoids in cacao (Theobroma cacao) keep coming, especially for cardiovascular health.

As I wrote earlier (Tea Time), tea, coffee, cacao and many fruits and vegetables are loaded with polyphenols, particularly flavonoids, which have antioxidant and other potentially useful properties. Flavonoids probably didn’t make it to my Halloween candy, but let’s start with the research findings.

Cognitive Function

Two years ago, an investigation led by researchers from Italy’s University of L'Aquila found that mild cognitive impairment in individuals, ages 64 to 82, improved with consumption of cocoa flavanols, a subclass of flavonoids.

Once daily, 90 test participants downed a drink that contained either low, medium or high levels of cocoa flavanols. After eight weeks, tests of memory and verbal fluency showed participant scores that aligned with the low to high flavanol levels. Blood pressure and insulin resistance also decreased among those who had consumed higher levels.

Hold that thought, because last month, a published report suggested that cocoa flavanols may go beyond improving to actually reversing age-related memory decline.

The recent study, led by investigators from Columbia University, had 37 healthy participants, ages 50 to 69, on a high or low flavanol diet for 3 months. Memory tests were given at the beginning and end of the study, and the participants were also examined with functional magnetic resonance imaging. The fMRI focused on the dentate gyrus of the brain’s hippocampus, which previous research has shown to be associated with memory decline typical of aging.

The study’s high-flavanol diet participants exhibited a marked improvement in cognitive and dentate gyrus function, establishing that dentate gyrus dysfunction is a driver of age-related cognitive decline and pointing to flavanols as a non-pharmacological means for its amelioration.

Possible Explanation of Health Benefits

At this year’s national conference of the American Chemical Society, a team of researchers from Louisiana State University reported laboratory simulation findings that may help explain the reason dark chocolate has health benefits.

The researchers tested three cocoa powders, employing a series of modified test tubes to simulate the digestive track. They then subjected the non-digestible residuals, which contained poorly digested polyphenols, such as flavanol, and small amounts of dietary fiber, to anaerobic fermentation using human fecal bacteria.

They found that gut bacteria, such as bifidobacteria and lactic acid bacteria, chow down on chocolate, producing compounds that are anti-inflammatory. When the body absorbs these compounds, inflammation of cardiovascular tissue is reduced as is the risk of stroke. Next step is to progress beyond simulations.
 

Wrap Up 

Now for the sad news. Enjoy your chocolate, with its added sugar and fat, but don’t expect much in the way of flavonoids and other polyphenols. Those compounds are generally destroyed in processing. The cocoa flavanol drink used in the cognitive studies was produced specially by the candy maker, Mars, Inc., a research collaborator that markets a cocoa-flavanol product, CocoaVia.

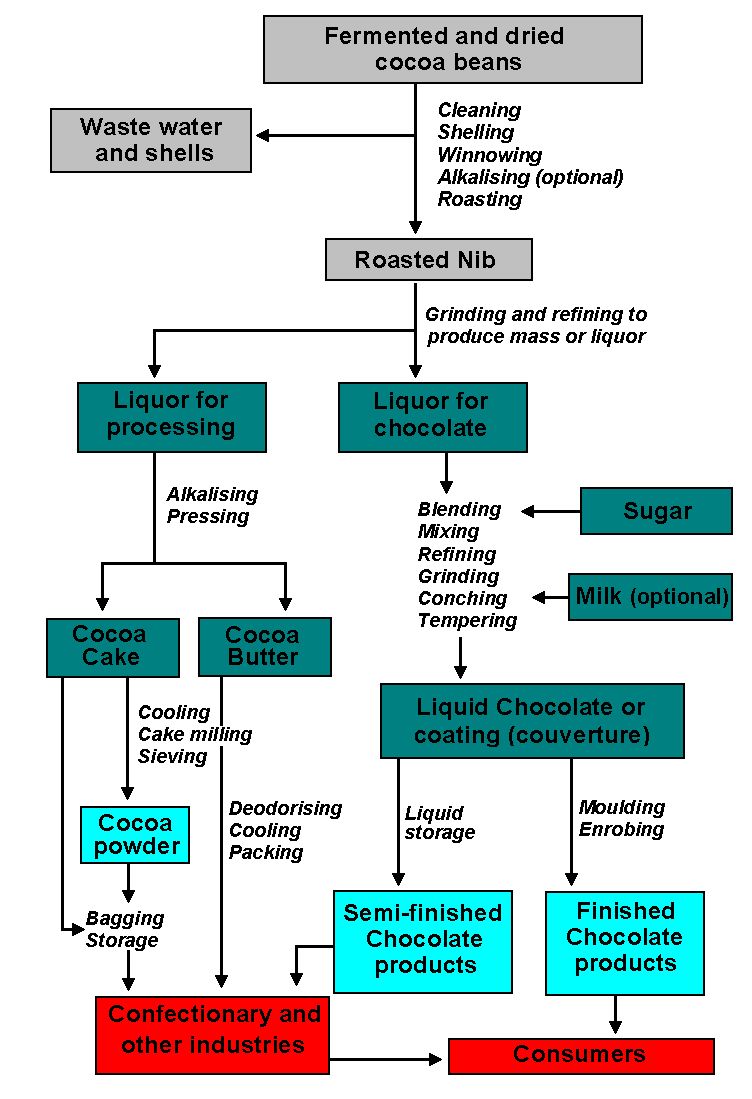
General steps in producing cocoa and chocolate
(www.food-info.net/images/chocolateflowsheet.jpg)
Mars, Inc. will also partner with the National Institutes of Health, Brigham and Women’s Hospital and the Fred Hutchinson Cancer Research Center in a 5-year study to evaluate the role of flavanols in reducing the risk of heart attack, stroke and death from cardiovascular disease in 18,000 women and men nationwide. That study kicks off in 2015.

So, nibble away at your dark chocolate, which usually has more flavanols, and stay tuned. And thanks for stopping by. I hope it was of interest.

P.S.

Work reviewed in blog post…
Hypertension journal paper and Berkeley Wellness article on 2012 cognitive function study:
hyper.ahajournals.org/content/60/3/794.full
www.berkeleywellness.com/healthy-eating/nutrition/article/chocolate-brain
Nature Neuroscience paper and Time article on 2014 cognitive function study:
www.nature.com/neuro/journal/vaop/ncurrent/full/nn.3850.html
time.com/3540703/cocoa-memory-loss-flavanols-aging-hippocampus/?xid=newsletter-brief
American Chemical Society press release and PDF package on Louisiana State study:
www.acs.org/content/acs/en/pressroom/newsreleases/2014/march/the-precise-reason-for-the-health-benefits-of-dark-chocolate-mystery-solved.html
graphics8.nytimes.com/packages/pdf/health/ACS.pdf

Related material…
Journal of Agricultural and Food Chemistry paper and Science Daily article on Virginia Tech study that examined specific flavanols to combat obesity and diabetes:
pubs.acs.org/doi/abs/10.1021/jf500333y
www.sciencedaily.com/releases/2014/04/140402110000.htm
Collection of links to papers and articles on chocolate’s health benefits: cocoarunners.com/explore/chocolate-health/
Cacao comeback in Puerto Rico:
www.ars.usda.gov/research/projects/projects.htm?accn_no=423953
bespokemagazineonline.com/cocoas-comeback/

25 November 2014

Politics and Physiology Addendum

Last Friday’s blog post, Innate Political Partisanship, highlighted two studies that suggest the potential for political partisanship is physiological. To reach that conclusion, the researchers employed measurements of electrodermal activity, eye tracking and functional magnetic resonance imaging (fMRI).

As you’d expect, there have been other approaches to investigating the potential link. Today, I’ll do a drive-by review of some you might find of interest. All compared results with test participants’ self-reported personality or sociopolitical assessments.

Friday’s two studies and those featured here cite numerous references should you wish to pursue the topic further.

Survey

A survey of a broad sample of adults was key to documenting a positive correlation between disgust sensitivity (predisposition to feel disgust) and more conservative political attitudes, especially on morality issues. The report appeared in the journal Cognition and Emotion in 2009.

OK, so it’s a baby. It’s still an expression of disgust. (Photo from hotmeme.net/memegenerator/14821/disgusted-baby/)

Monitoring and Inventory 

A study published in Political Psychology in 2008 monitored participants’ nonverbal behavior during interactions with two conversation partners and inventoried their personal possessions and living and working spaces.

Two traits--openness to new experiences and conscientiousness--captured many of the ways that political orientation differences have been conceptualized. In general, liberals were more open-minded, creative, curious and novelty seeking; conservatives were more orderly, conventional and better organized.


Well, at least the shelves in this office seem organized. And maybe some of the piles too. (Photo from my Reading Photo Addendum of 13 Sep 2011.)
Computer Game

A study reported in the Journal of Experimental Social Psychology in 2009 had participants play a computer game that required learning whether novel stimuli produced positive or negative outcomes.

Political ideology correlated with exploration and sampling of the stimuli during the game. More conservative participants were less open, sampling fewer targets than liberals, and they learned better from negative stimuli than from positive stimuli.


Test participants weren’t this young, but nowadays, babies are probably more familiar with computers than many adults. (Photo from multiple websites.)
DNA

Although I lack details of the findings of a 2011 report in the Journal of Politics, the work checked the box of another approach. The investigators conducted a genome-wide analysis of conservative-liberal attitudes from the DNA of 13,000 respondents. They noted that several significant linkage peaks and potential candidate genes were identified.


Our DNA may indeed influence how we vote. (Photo from thehoopla.com.au/vote-dna/)
Electroencephalography

A 2007 paper in the journal Nature Neuroscience described research that recorded electroencephalographs of test participants during a Go/No-Go task. They found greater liberalism was associated with stronger conflict-related anterior cingulate activity, which suggests that liberals have greater neurocognitive sensitivity to cues for altering a habitual response pattern. In short, if you accept that interpretation, conservatives would be more likely to continue a habitual response even if indicators signal change is needed.

Electroencephalograph measurements but from an unrelated research investigation. (Photo from www.sciencedaily.com/releases/2012/09/120912161554.htm)
Magnetic Resonance Imaging

Instead of fMRI, a study reported in Current Biology in 2011 used its sister technology, MRI, to examine brain structural differences. Greater liberalism was associated with increased gray matter volume in the anterior cingulate cortex, while greater conservatism was associated with increased gray matter volume of the right amygdala.

Among the amygdala’s many functions is fear processing. Individuals with a larger amygdala--in this study, conservatives--are more sensitive to fear. The liberals’ larger grey matter volume of the anterior cingulate cortex suggest a higher capacity to tolerate uncertainty and conflicts. Knock yourself out interpreting these results.

Schematic prolife illustrating brain’s anterior cingulate cortex and amygdala. (Photo from multiple websites.)
P.S.

Links to reviewed studies published in…
Political Psychology, 2008: onlinelibrary.wiley.com/doi/10.1111/j.1467-9221.2008.00668.x/full
Cognition and Emotion, 2009: www.tandfonline.com/doi/abs/10.1080/02699930802110007#.VGpM7snqOUn
Journal of Experimental Social Psychology, 2009: www.sciencedirect.com/science/article/pii/S0022103109000833
Journal of Politics, 2011: journals.cambridge.org/action/displayAbstract?fromPage=online&aid=7975084&fileId=S0022381610001015
Nature Neuroscience, 2007: www.nature.com/neuro/journal/v10/n10/full/nn1979.html
Current Biology, 2011: www.cell.com/current-biology/abstract/S0960-9822%2811%2900289-2

21 November 2014

Innate Political Partisanship

Welcome back. Did you vote? So what happened to throw the bums out? We reelected nearly every Congressmen to those 471 seats that were up for grabs. I suppose it’s really throw your bums out, not mine.

Cartoon should show the country
not the political parties getting
bruised. (multiple websites)
We did tell them to end partisanship and get something done, but that’s not going to be easy. Research, particularly over the past decade, suggests the potential for political partisanship goes pretty deep--that it’s physiological! It’s sort of like how tall you’ll be when you’re born. Here are two studies I thought told the story--and it’s a pretty cool story.

Physiological and Attention Links with Political Ideology

Researchers from the University of Nebraska conducted two experiments. For the first experiment, following a survey of political, personality and demographic information, physiological response data were collected on 46 test participants who were clearly left-leaning liberals or right-leaning conservatives.

The participants were shown 33 images while their electrodermal activity (skin conductance) was measured. Electrodermal activity has long been accepted as a good measure of emotion, arousal and attention.

The images had been rated by 126 judges on a nine-point scale of whether each image made them feel happy/positive (e.g., cute rabbit) or unhappy/negative (e.g., spider on a face). The judges also noted how strongly they felt an emotional reaction and the specific emotion (e.g., fear). Images of well-known political figures were also included.

Test results showed right-leaning participants exhibited greater electrodermal increases for unpleasant images compared to pleasant images and for politicians with whom they disagreed compared to politicians with whom they agreed. Left-leaning participants exhibited the opposite responses.

For the second experiment, the researchers administered an eye-tracking test to 76 undergraduates, whose political orientation was also collected. 


Eye tracker used in study (EyeLink II
from www.sr-research.com/EL_II.html)
The students viewed a series of image collages for 8 seconds each. Each collage was composed of four, same-size images. Six of the collages contained three unpleasant images and one pleasant image, and six collages contained three pleasant images and one unpleasant image. The students were free to direct their gaze toward any image.

The investigation focused on two measurements: dwell time--how long students spent looking at each image in each collage, and first fixation time--how long it took for students to look at either a pleasant or unpleasant image.

These test results showed right-leaning participants gazed longer at and fixated faster on unpleasant images than on pleasant images, while left-leaning participants exhibited the opposite responses, devoting more attention to pleasant images.

Add Brain Imaging

A recent collaborative study led by researchers from Virginia Tech added functional magnetic resonance image analysis to the investigation of physiological links with political orientation.


Example of an fMRI scanner
(photo from fmri.ucsd.edu/)
The researchers presented 80 nonpolitical, evocative images (20 each of “disgusting,” “threatening,” “pleasant” and “neutral” images) to 83 participants, who were in an fMRI scanner.

The participants subsequently rated on a nine-point scale the same images as disgusting, threatening or pleasant; and they completed questionnaires on their political attitudes, disgust sensitivity and state/trait anxiety level.

To test whether brain responses to evocative images predict individual scores on a standard political ideology assay, the researchers analyzed the fMRI data with a machine-learning method.

The key finding was with disgusting images, especially those related to animal-reminder disgust (e.g., mutilated body). Those images generated brain responses that were highly predictive of political orientation even though the predictions did not agree with the ratings the participants compiled after the fMRI scans. Notably, a single disgusting image was sufficient to make accurate predictions about an individual’s political ideology, and only the disgusting images supported the fMRI-based predictions.

Wrap Up


Keys for compromise
(multiple websites)
The message of these findings is See, there is a difference. Those on opposite sides of the political spectrum may simply experience the world differently. Change is always possible, but we can at least hope that our elected leaders will go beyond reacting in accordance with any innate political orientation. If they stop and think, maybe they’ll even compromise. Thanks for stopping by.

P.S.

-University of Nebraska study in Philosophical Transactions of the Royal Society B journal: rstb.royalsocietypublishing.org/content/367/1589/640.full.html#ref-list-1
-Virginia Tech led study in Current Biology and article on Science Daily website:
www.cell.com/current-biology/fulltext/S0960-9822%2814%2901213-5
www.sciencedaily.com/releases/2014/10/141029124502.htm
-Earlier blog post on more drastic moments in Congressional compromise: www.retired--nowwhat.com/2013/07/congressional-action-addendum.html

18 November 2014

Science Increases Trust Addendum

There’s such a rich trove of material that could be tapped for an addendum to last Friday’s blog topic, Science Increases Trust, I thought I’d roll out a dessert cart instead offering a single treat. As a reminder, the blog post reviewed a Cornell study that documented how adding scientific-looking data to a sales pitch for a medication increased confidence in the product, even if the data provided no new information. 
A package of Ivory Soap
that I bought last week.

Ivory Soap has been touting that it’s 99.44 percent pure since the 1880s! That scientific-sounding data apparently came about when chemical analysis determined that “impurities” totaled 0.56% of the soap’s content. Actually, the impurities--uncombined alkali, carbonates and mineral matter--sound better than Ivory’s “pure” ingredients, fatty acids and alkali, which are the chief ingredients of most soap.
Most TV ads for pharmaceuticals,
2008-2010, were found to be
misleading or worse. (photo on
multiple websites)

The Cornell study addressed promotions with redundant, not misleading data; however, an earlier investigation by collaborators from Dartmouth and the University of Wisconsin took a swing at consumer-targeted television drug advertising. 

They analyzed the most emphasized claims of 84 prescription and 84 nonprescription drug ads, randomly selected from national news broadcasts from 2008 through 2010. Taken together, 57% of the claims were potentially misleading and 10% were false. Claims for prescription drug ads came out a bit better than those for nonprescription drug ads.

Graphs were one type of data the Cornell study showed could add the right touch of science to a sales pitch. Alas, graphs can also be used to mislead. For example, even if the graph’s axes are labeled correctly, not scaling to zero can cause the data to appear oh so different. Of course adding a biased title will help.
 
The massive increase in home prices in the top
graph doesn’t appear very massive when the prices
are scaled to zero euros in the bottom graph. (from
www.mathcaptain.com/algebra/misleading-graphs.html)
Dr. Phil’s Shape Up! was removed
after a Federal Trade Commission
investigation. (multiple websites)
Probably the worst purveyors of bad ads nowadays are those pitching weight loss. One such product, Shape Up!, was promoted by TV’s Dr. Phil as having “scientifically researched levels of ingredients.” Production of Shape Up! ended after a Federal Trade Commission investigation. More recently, the FTC and a Congressional subcommittee were after TV’s Dr. Oz for his weight loss promotions.

The tobacco industry’s advertising heyday has passed, yet it would be hard to top old cigarette ads for covering the bases. 


They had weight loss ads:
This ad suggested cigarettes instead of sweets to keep your weight down. (ad on multiple websites)
They had medical testing ads, such as this one, which stated: “A medical specialist is making regular bi-monthly examinations of a group of people” nearly half of whom have “smoked Chesterfield for an average of 10 years.” After 10 months, the specialist observed “no adverse effects on the nose, throat and sinuses of the group from smoking Chesterfield.”  
Arthur Godfrey, the spokesman in this cigarette ad, died of lung cancer after coming out strongly against smoking. (ad on multiple websites)
The ads had physicians:
Family doctors smoked; why shouldn’t you? (ad on multiple websites)
And for the epitome of scientific data, cigarette ads had scientists and educators. (Yes, most of us looked and dressed like the man in the ad.) 
Scientists and educators who smoked Kent weren’t thrilled to learn that the Micronite Filter contained asbestos. (ad on multiple websites)
P.S.

Ivory Soap:
www.straightdope.com/columns/read/870/ivory-soap-is-99-and-44-100-pure-what
www.nytimes.com/1994/05/22/magazine/sunday-may-22-1994-99.44-percent-pure-what.html
Dartmouth-Univ. of Wisconsin study in Journal of General Internal Medicine and article on Science Daily website:
link.springer.com/article/10.1007%2Fs11606-013-2604-0#page-1
www.sciencedaily.com/releases/2013/09/130916140455.htm
Dr. Phil's Shape Up!:
newswire.uark.edu/articles/9371/claims-that-are-too-good-to-be-true-watching-for-the-red-flags-in-advertising
usatoday30.usatoday.com/life/people/2006-09-26-dr-phil-diet_x.htm
Vintage tobacco ads: www.vintageadbrowser.com/tobacco-ads
Physicians and cigarettes: www.healio.com/hematology-oncology/news/print/hemonc-today/%7B241d62a7-fe6e-4c5b-9fed-a33cc6e4bd7c%7D/cigarettes-were-once-physician-tested-approved
Arthur Godfrey: en.wikipedia.org/wiki/Arthur_Godfrey
Micronite filter: www.asbestos.com/products/general/cigarette-filters.php

14 November 2014

Science Increases Trust

Welcome back. Suppose you’re out buying food for your pet unicorn. You walk into my pet store, and I tell you, “A survey showed that 8 out of 10 unicorns prefer the new crunchy grass mix over the old creamy grass mix.”

Now suppose that, in addition, I show you either a graph (see figure) or formula that depicts that statistic:

Creamy Mix (20%) + Crunchy Mix (80%) = Unicorn Grass Preference (100%) 

Graph illustrating 8 out of 10
unicorns prefer crunchy grass
mix over creamy grass mix.

Would the graph or formula help you choose which grass mix to buy? Would your feelings toward science make a difference?

Last Friday’s blog post highlighted a study that found scientists, and by extension, science, may be respected but not trusted (Trust a Scientist). Here’s a new twist on trust in science.

Trivial Scientific Data

A recent report by Cornell University investigators documented how adding scientifically formatted data to a sales pitch for a product--even if it provided no new information--increased trust in the product. This isn’t the old Madison Avenue obfuscation with more or less scientific, irrelevant information; this is simply adding unnecessary, redundant detail that looks scientific.

The investigators conducted three separate studies. For the first study, 61 participants read a paragraph about a new medication. Half of the participants were also given a graph that provided no additional information. When the participants were later asked if the medication reduced illness, about 30% more said yes if they’d seen the graph.

The second study gave 56 participants either the same paragraph and graph or the paragraph without the graph but with an added sentence that repeated that the medication reduced illness by 20%. All participants were later asked (i) to estimate how much the medication reduced illness and (ii) how much they agreed with the statement, “I believe in science.”

When it came to recalling the percentage by which the medication reduced illness, there was no difference between those who had seen the graph and those who had read the added sentence. Yet the participants who saw the graph and professed a belief in science expressed the strongest confidence in the medication’s effectiveness. Scientific-looking information--the graph--was perceived as true even if it had no affect on information retention.

The third study gave 57 participants the same paragraph, but half of the participants were also given the chemical formula of the medication’s active ingredient. Although the paragraph stated that the new medication would work 5.9 hours versus the old medication’s 3.8 hours, those who saw the formula believed that the new medication would work an additional two hours longer.

Wrap Up

The investigators concluded that adding scientific-looking data increased confidence in the medication’s efficacy. Since the data didn’t improve comprehensibility or recall, the apparent reason was that the data were linked with science and that science conveys truth, especially for some people.

However you feel about science, the next time you’re out buying food for your pet unicorn, make sure to read the ingredients carefully and don’t be swayed just because something looks scientific. Grass mixes are not the same to unicorns. Thank you for shopping in my pet store. Please stop by again.

P.S.


Cornell report in Public Understanding of Science:
pus.sagepub.com/content/early/2014/09/23/0963662514549688
Press release on the report and a department summary:
www.newswise.com/articles/blinded-by-non-science-trivial-scientific-information-increases-trust-in-products
foodpsychology.cornell.edu/OP/trivial_graph
Article on the report on Science Daily website:
www.sciencedaily.com/releases/2014/10/141017101224.htm
Background on unicorn food:
www.unicorns.co.za/unicorn-facts/unicorn-food.html