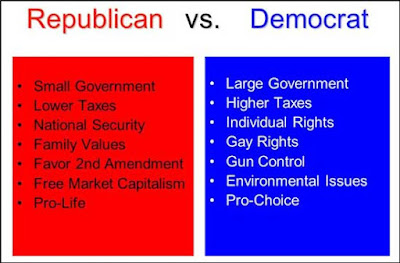
Welcome back. So, I see this research study summary that says Democratic county death rates are lower than that of Republican counties. I think, Cool! a satire, instead of thinking, Of course!
I had no idea earlier studies had shown counties that elect Republicans tend to experience worse health outcomes. But doesn’t it stand to reason?
The political environment drives policies, laws and regulations that influence health. That includes safety net programs (e.g., Medicaid), gun laws, environmental protections, tobacco control, communicable disease health behaviors (e.g., social distancing, mask mandates and vaccine acceptance) as well as traditional health behaviors (e.g., healthy diet, exercise).
So, I was intrigued to learn more.
Study Researchers, Design and Data
The recently published study was conducted by researchers affiliated with VA Boston Healthcare System, Brigham and Women’s Hospital, Harvard Medical School, Dow University of Health Sciences (Pakistan), Houston Methodist Hospital, Washington University School of Medicine and Beth Israel Deaconess Medical Center.
The team set out to assess recent trends in age-adjusted mortality rates (AAMRs) in the U.S. based on county-level presidential voting patterns. (Age-adjusting controls the influence that different population age distributions might have on health event rates.)
They linked death certificate data between 2001 and 2019 from the Centers for Disease Control and Prevention’s WONDER database with country-level presidential elections data from MIT’s Election Data and Science Laboratory from 2000 to 2019. The linked data comprised 3112 of 3143 counties or county equivalents and 99.8% of the U.S. population.
For the analysis, counties were classified as either Democratic or Republican based on the way the county had voted in the previous presidential election and adjusted for age when calculating mortality rates.
The study period encompassed 5 presidential elections from 2000 (673 Democratic counties, population 132,833,397; 2439 Republican counties, 147,957,141) to 2019 (490 Democratic counties, 176,971,611; 2622 Republican counties, 145,413,920).
Democratic vs Republican County Mortality
The researchers found that, from 2001 to 2019, the age-adjusted mortality rates per 100,000 people decreased by 22% in Democratic counties and by 11% in Republican counties. The greater reductions in mortality rates were across most common causes of death (i.e., heart disease, cancer, chronic lower respiratory tract diseases, diabetes, influenza and pneumonia, and kidney disease).
 |
| Age-adjusted mortality rates per 100,000 residents of counties voting for Democratic or Republican presidential candidates, 2001 to 2019 (modified from www.bmj.com/content/377/bmj-2021-069308). |
 |
| Age-adjusted mortality rates per 100,000 population for the 10 most common causes of death in Democratic and Republican counties in 2001 and 2019 (from www.bmj.com/content/377/bmj-2021-069308). |
Although there was little gap between improvements in mortality rates that Black and Hispanic Americans experienced in Democratic and Republican counties, the gap White Americans experienced was substantial. That gap grew over time.
 |
Age-adjusted mortality rates per 100,000 residents of counties voting for Democratic or Republican presidential candidates, 2001 to 2019, by race and ethnicity (from www.bmj.com/content/377/bmj-2021-069308). |
Wrap Up
Overall, the finding that Democratic counties experienced steeper declines in mortality than Republican counties over the past two decades builds upon previous evidence that more liberal policies, laws and regulations may be associated with better health outcomes.
There’s no need to move to a different county; just vote Democratic. Thanks for stopping by.
P.S.
Study of political environment and mortality rates in the British Medical Journal (BMJ): www.bmj.com/content/377/bmj-2021-069308
Articles on study on EurekAlert! website:
www.eurekalert.org/news-releases/955082
www.eurekalert.org/news-releases/954985


No comments:
Post a Comment